MathsFreePrintable

Probability Station Data Worksheets

A free maths worksheet ready for your classroom. Open in Kuraplan to grab the print-ready PDF, customize it for your students, or generate a fresh version in seconds.

Probability Station Data Worksheets worksheet preview
Name:Date:

Probability Station Data Worksheets

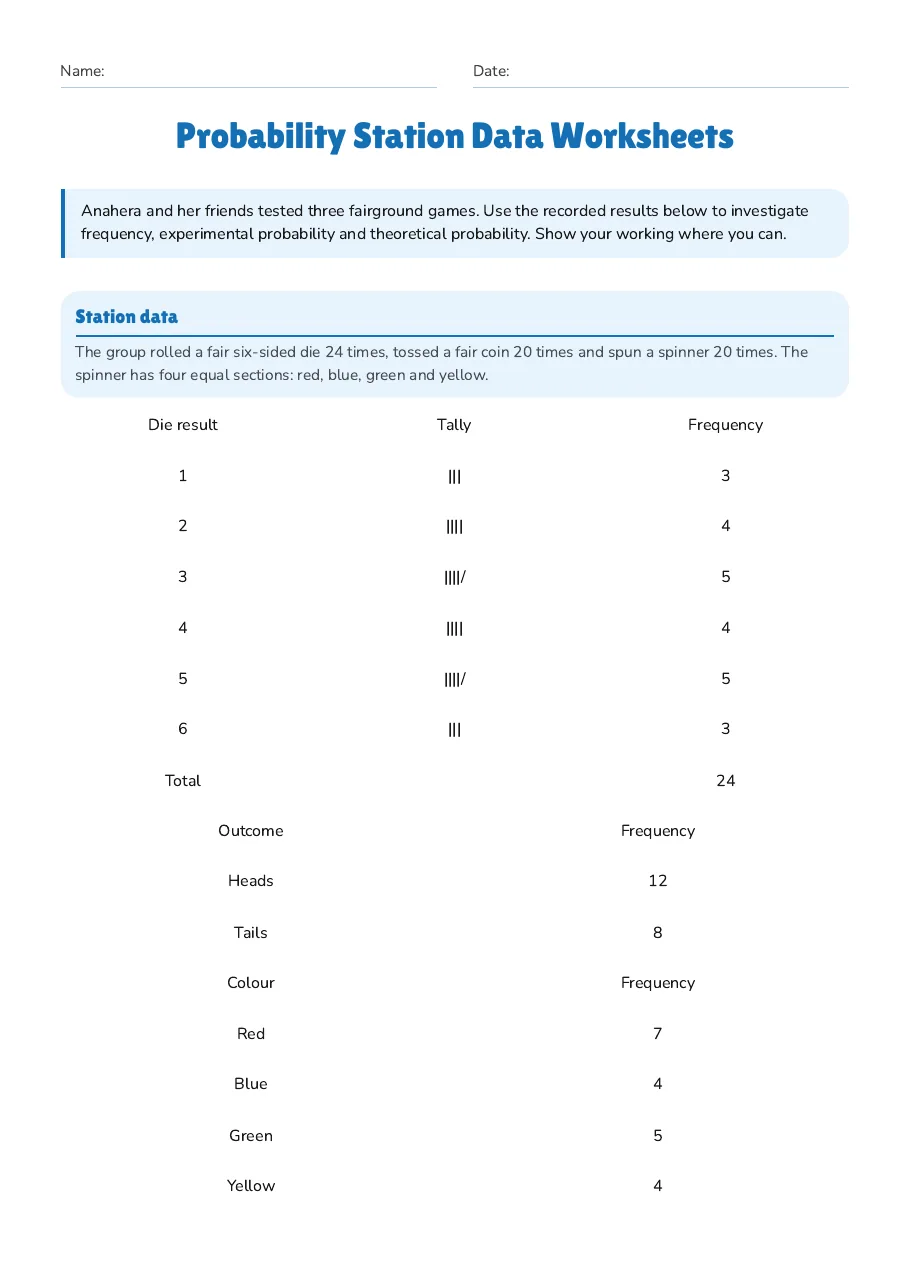
Anahera and her friends tested three fairground games. Use the recorded results below to investigate frequency, experimental probability and theoretical probability. Show your working where you can.

Station data

The group rolled a fair six-sided die 24 times, tossed a fair coin 20 times and spun a spinner 20 times. The spinner has four equal sections: red, blue, green and yellow.

Die result

Tally

Frequency

1

|||

3

2

||||

4

3

||||/

5

4

||||

4

5

||||/

5

6

|||

3

Total

24

Outcome

Frequency

Heads

12

Tails

8

Colour

Frequency

Red

7

Blue

4

Green

5

Yellow

4

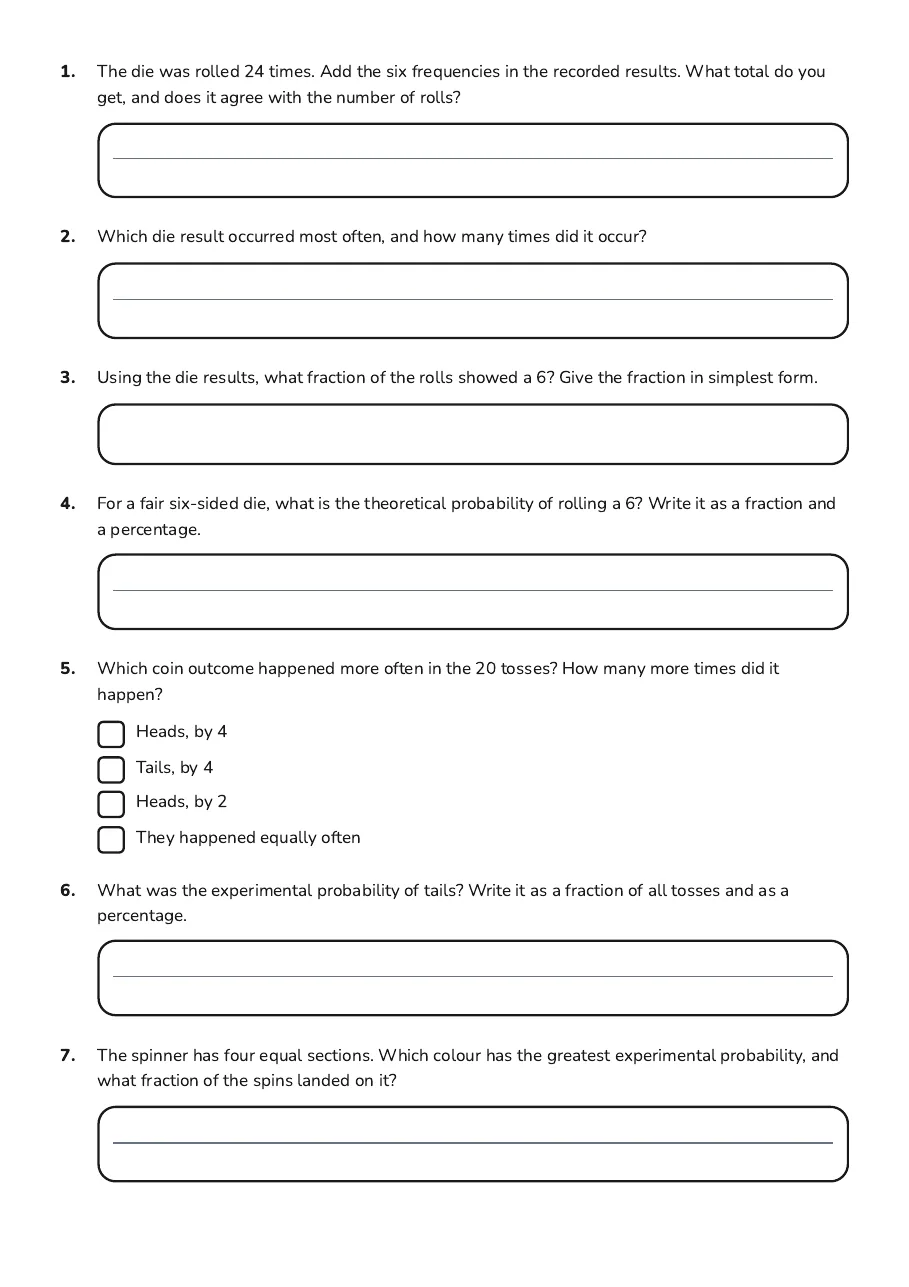
1.The die was rolled 24 times. Add the six frequencies in the recorded results. What total do you get, and does it agree with the number of rolls?
2.Which die result occurred most often, and how many times did it occur?
3.Using the die results, what fraction of the rolls showed a 6? Give the fraction in simplest form.
4.For a fair six-sided die, what is the theoretical probability of rolling a 6? Write it as a fraction and a percentage.
5.Which coin outcome happened more often in the 20 tosses? How many more times did it happen?
  • Heads, by 4
  • Tails, by 4
  • Heads, by 2
  • They happened equally often
6.What was the experimental probability of tails? Write it as a fraction of all tosses and as a percentage.
7.The spinner has four equal sections. Which colour has the greatest experimental probability, and what fraction of the spins landed on it?
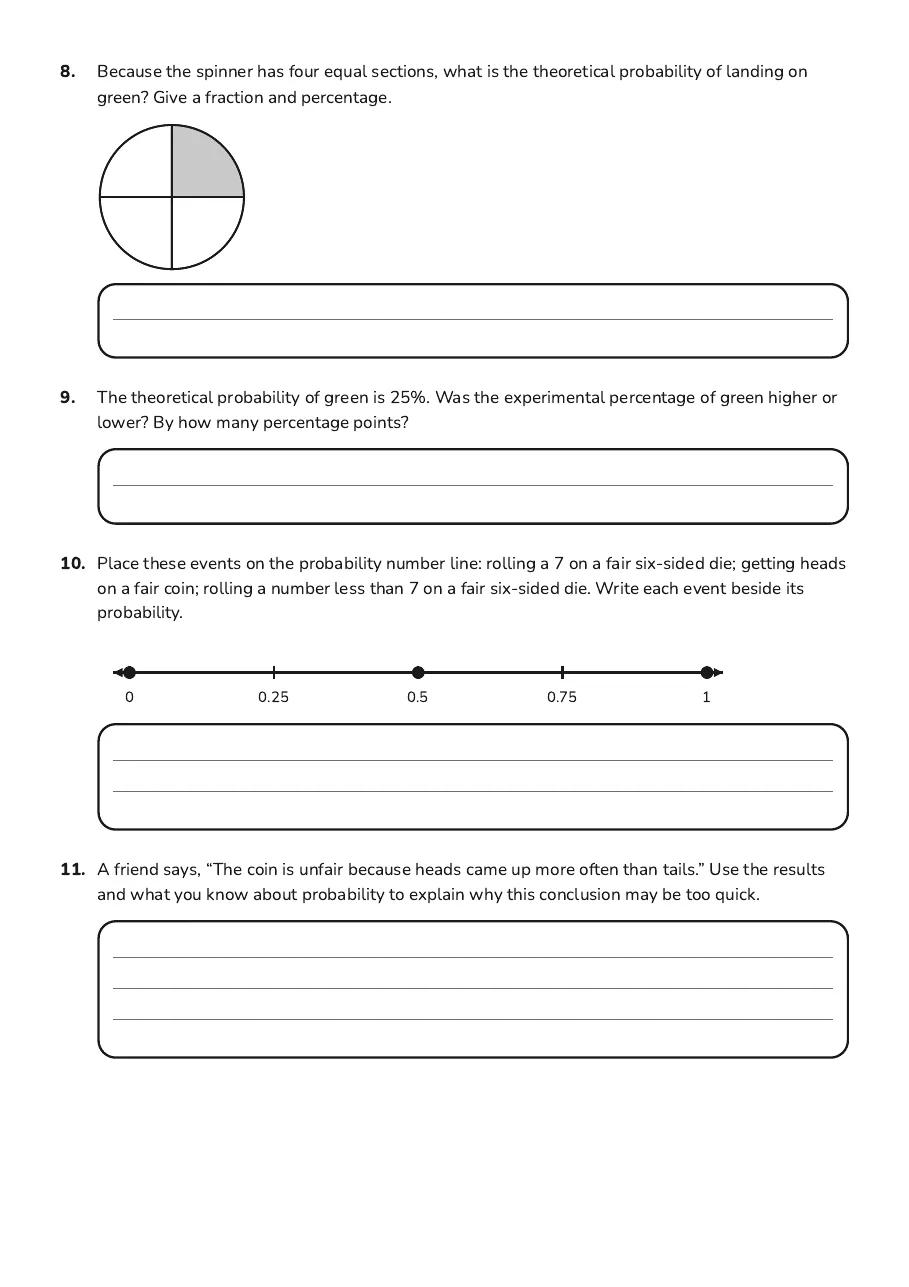
8.Because the spinner has four equal sections, what is the theoretical probability of landing on green? Give a fraction and percentage.
9.The theoretical probability of green is 25%. Was the experimental percentage of green higher or lower? By how many percentage points?
10.Place these events on the probability number line: rolling a 7 on a fair six-sided die; getting heads on a fair coin; rolling a number less than 7 on a fair six-sided die. Write each event beside its probability.
00.250.50.751
11.A friend says, “The coin is unfair because heads came up more often than tails.” Use the results and what you know about probability to explain why this conclusion may be too quick.

3 printable pages

  • Probability Station Data Worksheets, page 1 of 3: Station data

    Page 1

  • Probability Station Data Worksheets, page 2 of 3: 1. The die was rolled 24 times. Add the six frequencies in the recorded results. What…

    Page 2

  • Probability Station Data Worksheets, page 3 of 3: 8. Because the spinner has four equal sections, what is the theoretical probability of…

    Page 3

About This Worksheet

Free in Kuraplan

Sign up free, grab the PDF, and customize it for your class.

Print-Ready

Formatted for standard paper. Clean layout, easy to read.

AI-Generated

Created with Kuraplan's AI, designed for real classroom use.

For Teachers & Parents

Use in classrooms, for homework, tutoring, or homeschool.

Need a custom version of this worksheet?

Kuraplan's AI generates custom worksheets in seconds — differentiated for every learner, aligned to your curriculum.

Generate Custom Worksheets — Free
No credit card Curriculum-aligned Under 60 seconds