MathsFreePrintable

RAU Favourite-Animal Data Analysis

A free maths worksheet ready for your classroom. Open in Kuraplan to grab the print-ready PDF, customize it for your students, or generate a fresh version in seconds.
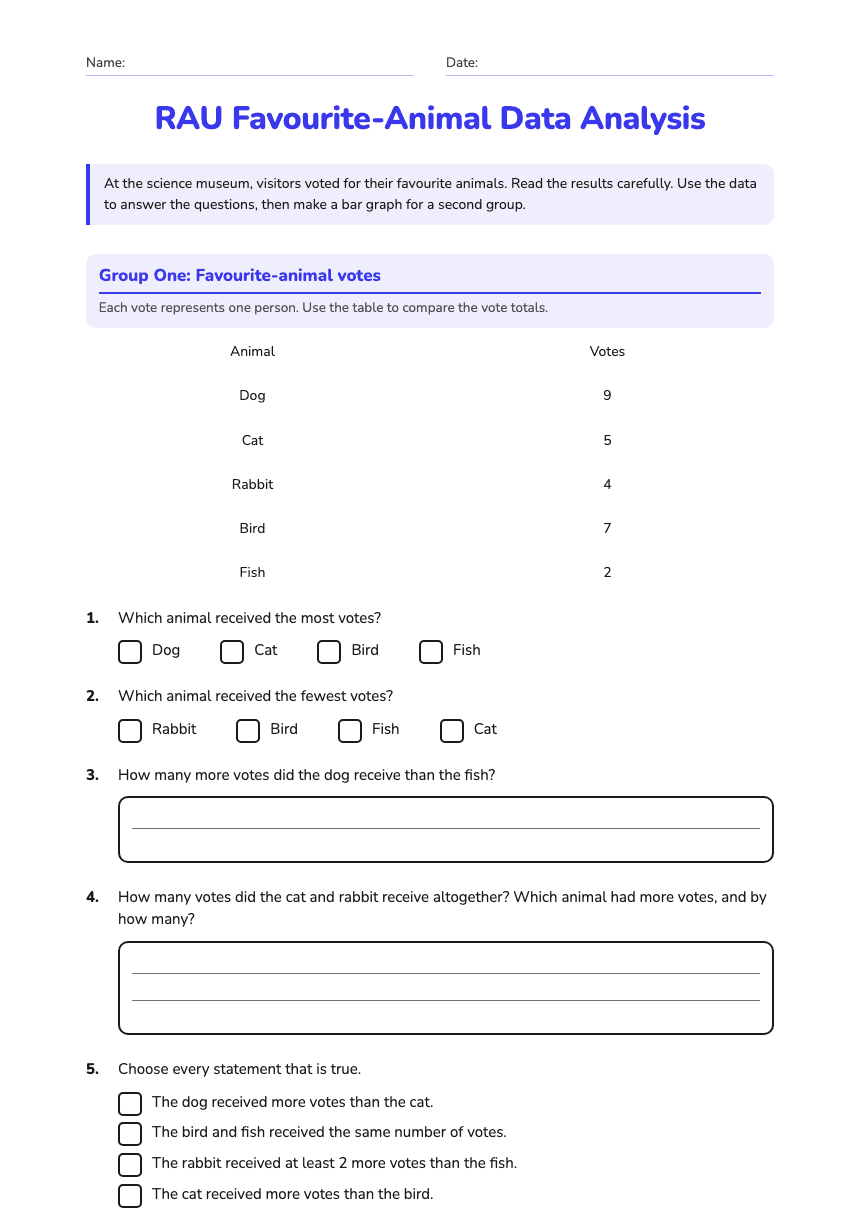
RAU Favourite-Animal Data Analysis worksheet preview
Name:Date:

RAU Favourite-Animal Data Analysis

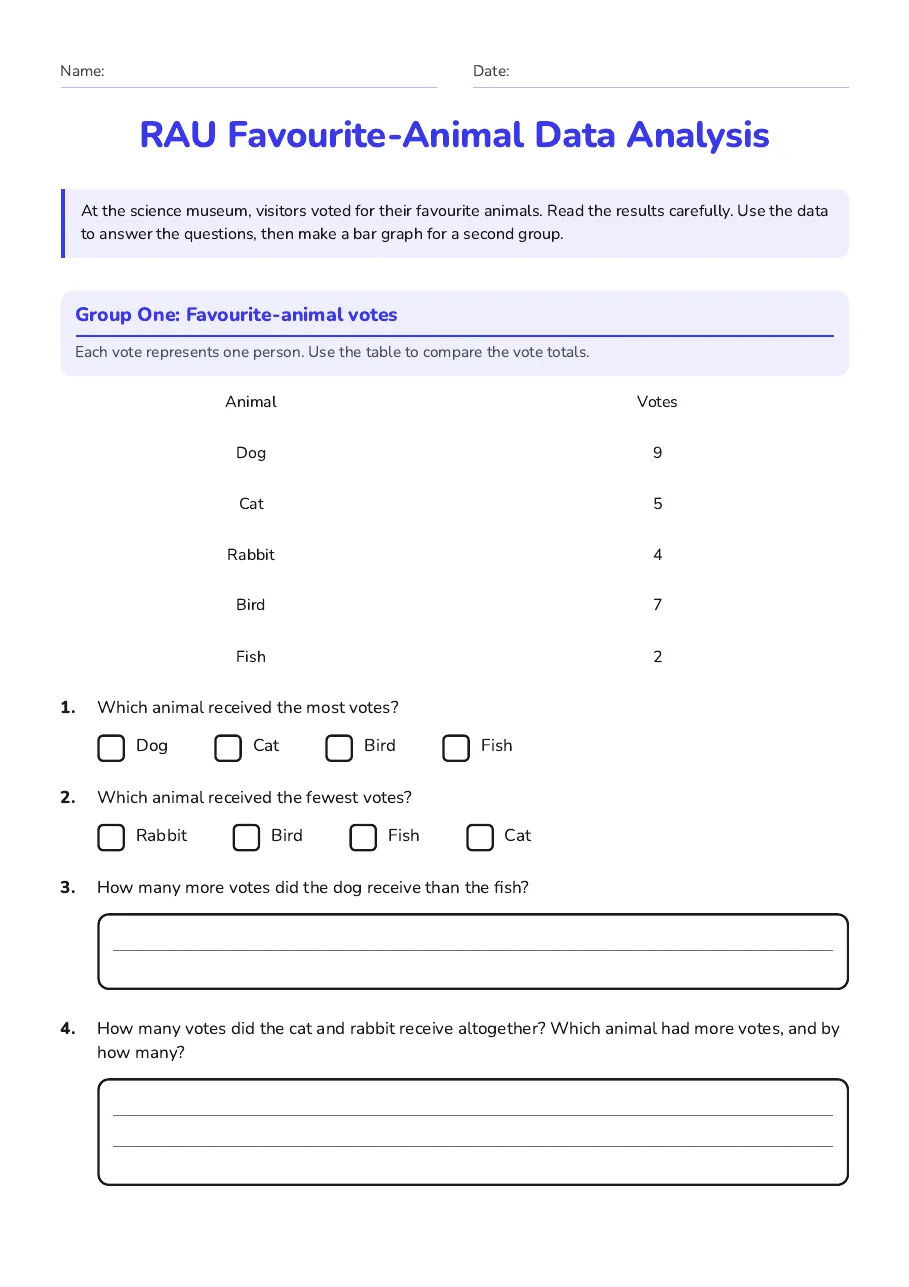
At the science museum, visitors voted for their favourite animals. Read the results carefully. Use the data to answer the questions, then make a bar graph for a second group.

Group One: Favourite-animal votes

Each vote represents one person. Use the table to compare the vote totals.

Animal

Votes

Dog

9

Cat

5

Rabbit

4

Bird

7

Fish

2

1.Which animal received the most votes?
  • Dog
  • Cat
  • Bird
  • Fish
2.Which animal received the fewest votes?
  • Rabbit
  • Bird
  • Fish
  • Cat
3.How many more votes did the dog receive than the fish?
4.How many votes did the cat and rabbit receive altogether? Which animal had more votes, and by how many?
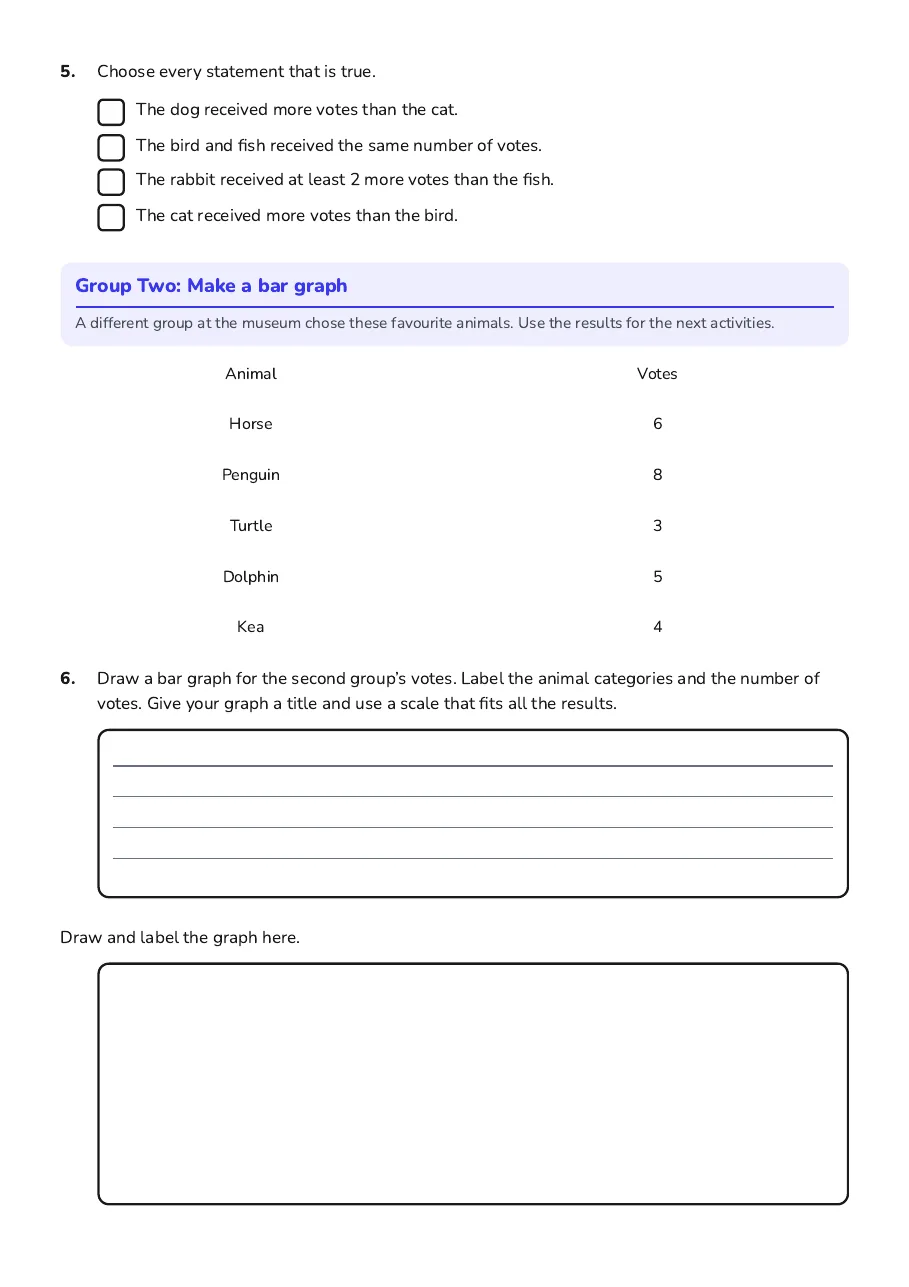
5.Choose every statement that is true.
  • The dog received more votes than the cat.
  • The bird and fish received the same number of votes.
  • The rabbit received at least 2 more votes than the fish.
  • The cat received more votes than the bird.

Group Two: Make a bar graph

A different group at the museum chose these favourite animals. Use the results for the next activities.

Animal

Votes

Horse

6

Penguin

8

Turtle

3

Dolphin

5

Kea

4

6.Draw a bar graph for the second group’s votes. Label the animal categories and the number of votes. Give your graph a title and use a scale that fits all the results.
Draw and label the graph here.
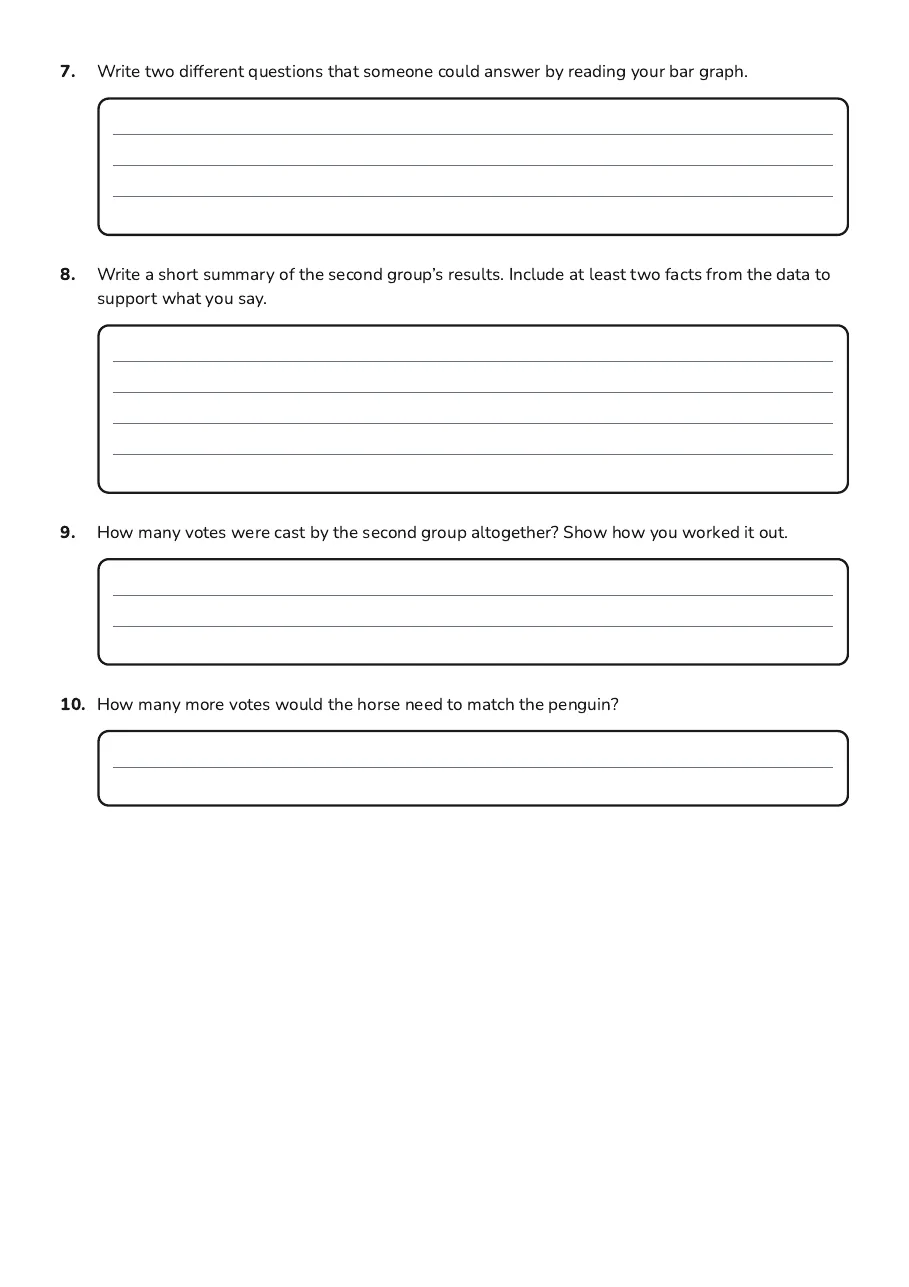
7.Write two different questions that someone could answer by reading your bar graph.
8.Write a short summary of the second group’s results. Include at least two facts from the data to support what you say.
9.How many votes were cast by the second group altogether? Show how you worked it out.
10.How many more votes would the horse need to match the penguin?

3 printable pages

  • RAU Favourite-Animal Data Analysis, page 1 of 3: Group One: Favourite-animal votes

    Page 1

  • RAU Favourite-Animal Data Analysis, page 2 of 3: Group Two: Make a bar graph

    Page 2

  • RAU Favourite-Animal Data Analysis, page 3 of 3: 7. Write two different questions that someone could answer by reading your bar graph.

    Page 3

About This Worksheet

Free in Kuraplan

Sign up free, grab the PDF, and customize it for your class.

Print-Ready

Formatted for standard paper. Clean layout, easy to read.

AI-Generated

Created with Kuraplan's AI, designed for real classroom use.

For Teachers & Parents

Use in classrooms, for homework, tutoring, or homeschool.

Need a custom version of this worksheet?

Kuraplan's AI generates custom worksheets in seconds — differentiated for every learner, aligned to your curriculum.

Generate Custom Worksheets — Free
No credit card Curriculum-aligned Under 60 seconds