MathsFreePrintable
Statistical Enquiry Data Analysis
A free maths worksheet ready for your classroom. Open in Kuraplan to grab the print-ready PDF, customize it for your students, or generate a fresh version in seconds.
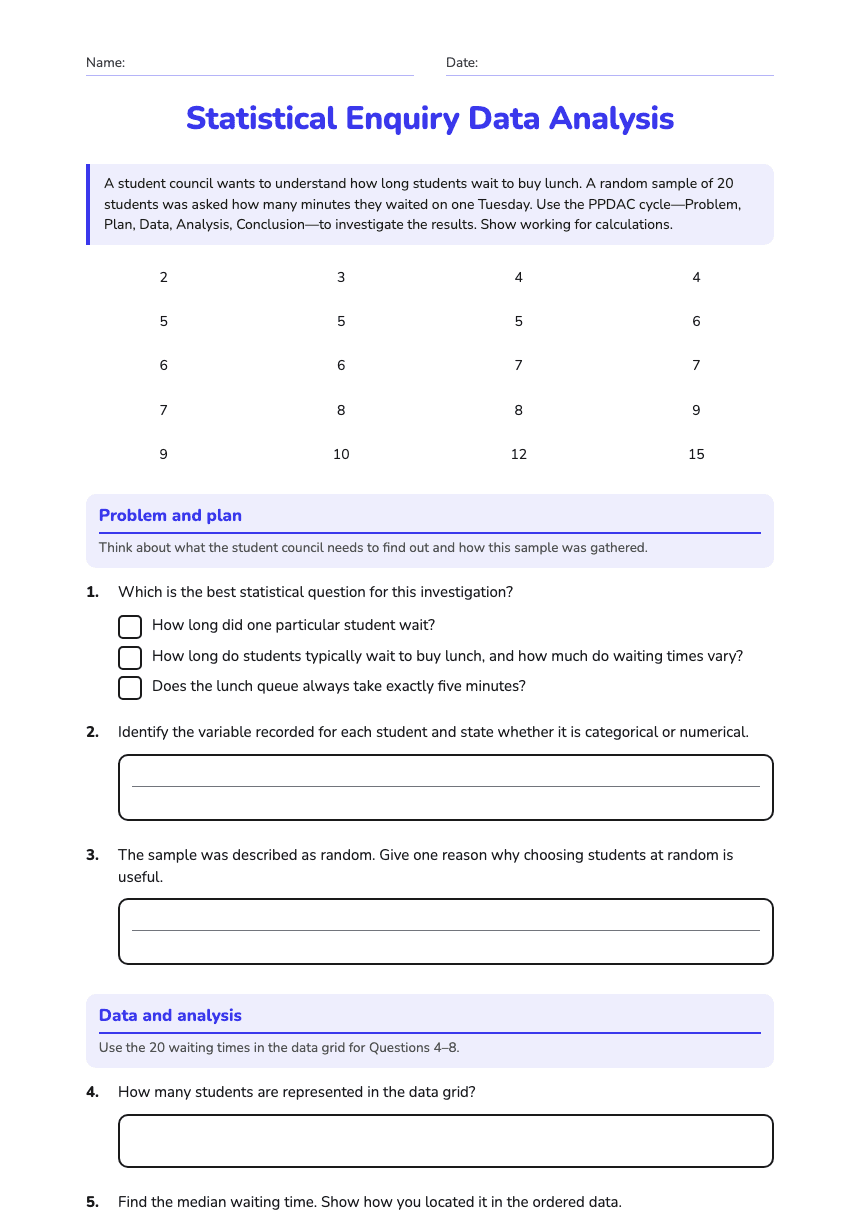
Name:Date:
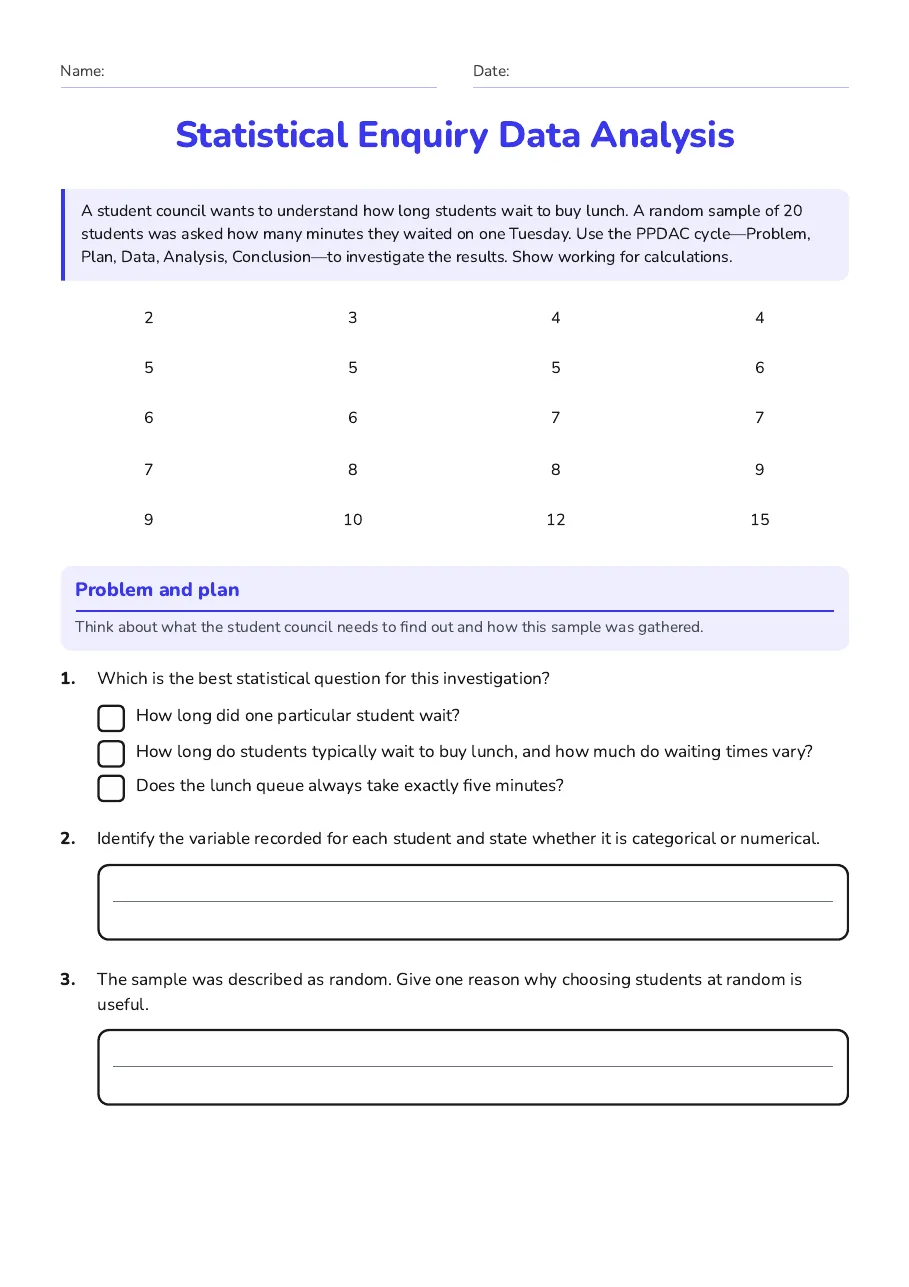
Statistical Enquiry Data Analysis
A student council wants to understand how long students wait to buy lunch. A random sample of 20 students was asked how many minutes they waited on one Tuesday. Use the PPDAC cycle—Problem, Plan, Data, Analysis, Conclusion—to investigate the results. Show working for calculations.
2
3
4
4
5
5
5
6
6
6
7
7
7
8
8
9
9
10
12
15
Problem and plan
Think about what the student council needs to find out and how this sample was gathered.
1.Which is the best statistical question for this investigation?
- How long did one particular student wait?
- How long do students typically wait to buy lunch, and how much do waiting times vary?
- Does the lunch queue always take exactly five minutes?
2.Identify the variable recorded for each student and state whether it is categorical or numerical.
3.The sample was described as random. Give one reason why choosing students at random is useful.
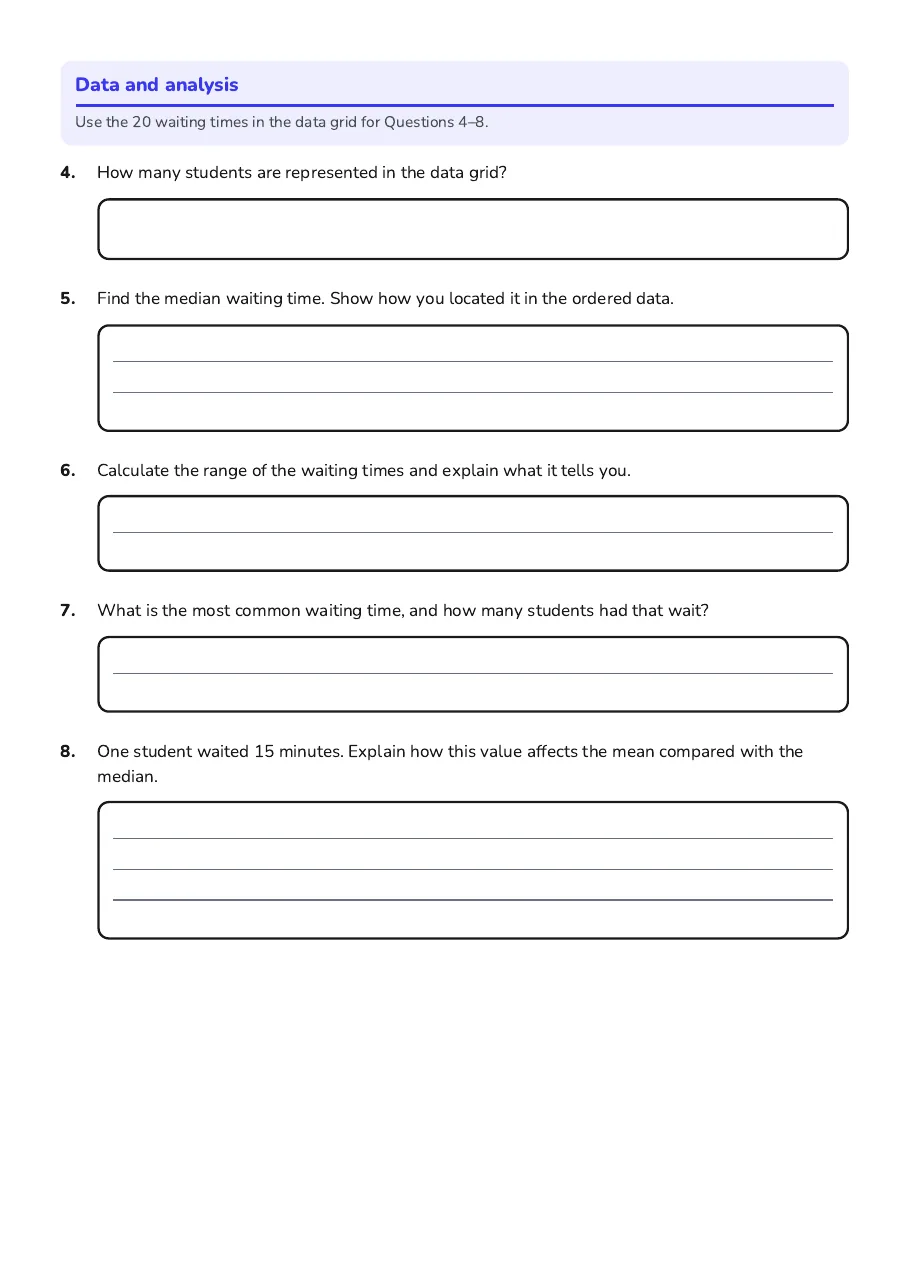
Data and analysis
Use the 20 waiting times in the data grid for Questions 4–8.
4.How many students are represented in the data grid?
5.Find the median waiting time. Show how you located it in the ordered data.
6.Calculate the range of the waiting times and explain what it tells you.
7.What is the most common waiting time, and how many students had that wait?
8.One student waited 15 minutes. Explain how this value affects the mean compared with the median.
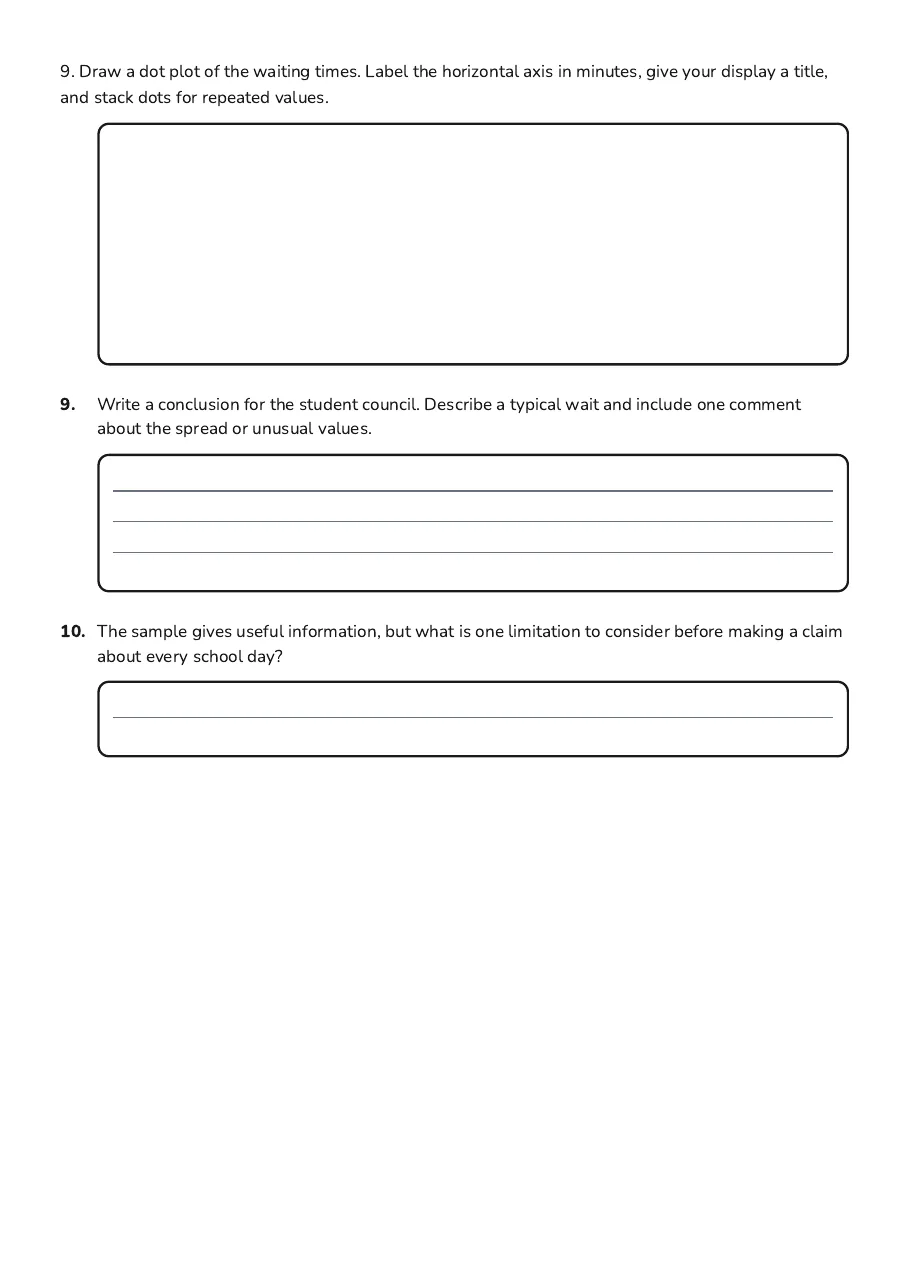
9. Draw a dot plot of the waiting times. Label the horizontal axis in minutes, give your display a title, and stack dots for repeated values.
9.Write a conclusion for the student council. Describe a typical wait and include one comment about the spread or unusual values.
10.The sample gives useful information, but what is one limitation to consider before making a claim about every school day?
3 printable pages
Page 1
Page 2
Page 3
About This Worksheet
Free in Kuraplan
Sign up free, grab the PDF, and customize it for your class.
Print-Ready
Formatted for standard paper. Clean layout, easy to read.
AI-Generated
Created with Kuraplan's AI, designed for real classroom use.
For Teachers & Parents
Use in classrooms, for homework, tutoring, or homeschool.
Need a custom version of this worksheet?
Kuraplan's AI generates custom worksheets in seconds — differentiated for every learner, aligned to your curriculum.
Generate Custom Worksheets — Free No credit card Curriculum-aligned Under 60 seconds