MathsFreePrintable

Statistics Basics Introduction

A free maths worksheet ready for your classroom. Open in Kuraplan to grab the print-ready PDF, customize it for your students, or generate a fresh version in seconds.
Statistics Basics Introduction worksheet preview
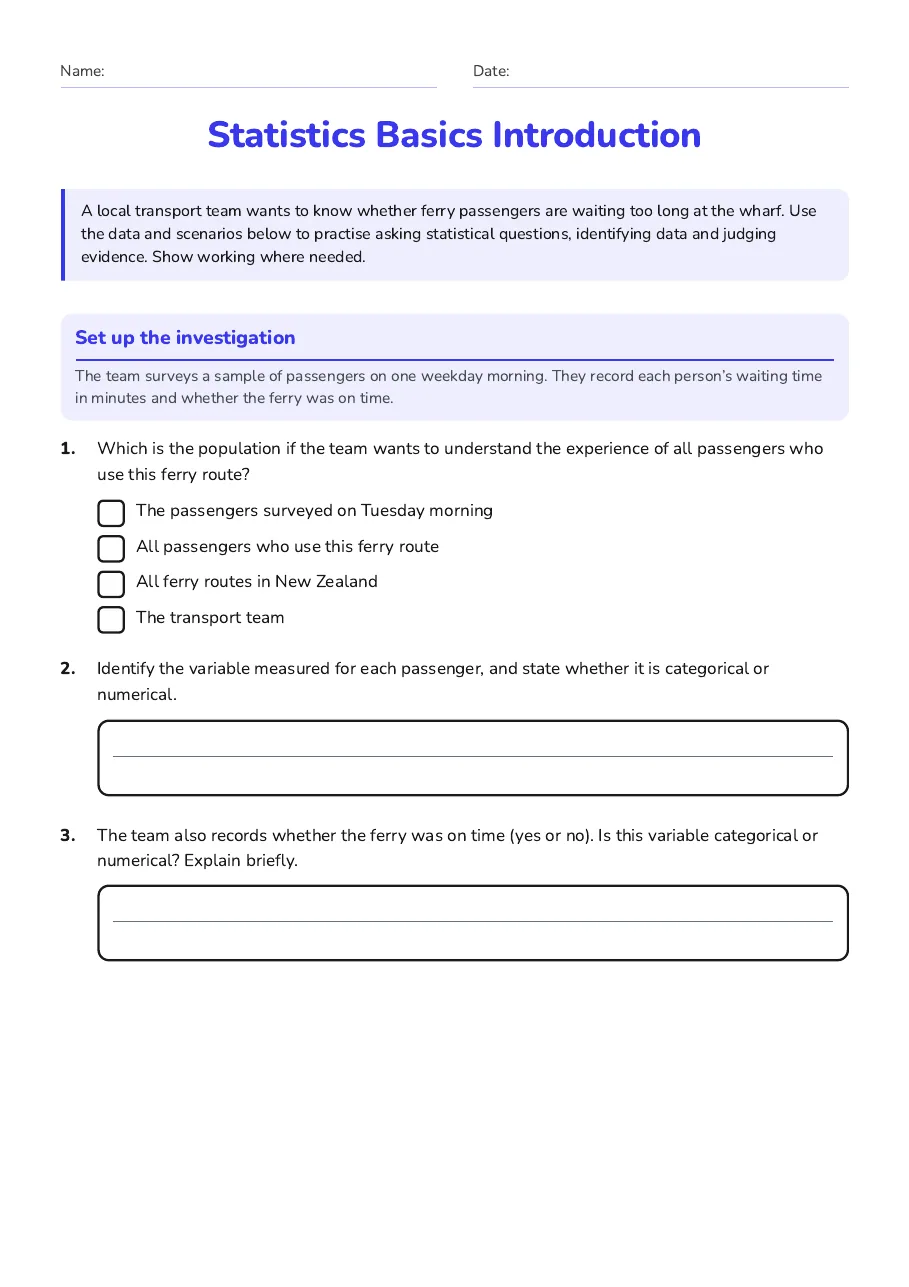
Name:Date:

Statistics Basics Introduction

A local transport team wants to know whether ferry passengers are waiting too long at the wharf. Use the data and scenarios below to practise asking statistical questions, identifying data and judging evidence. Show working where needed.

Set up the investigation

The team surveys a sample of passengers on one weekday morning. They record each person’s waiting time in minutes and whether the ferry was on time.

1.Which is the population if the team wants to understand the experience of all passengers who use this ferry route?
  • The passengers surveyed on Tuesday morning
  • All passengers who use this ferry route
  • All ferry routes in New Zealand
  • The transport team
2.Identify the variable measured for each passenger, and state whether it is categorical or numerical.
3.The team also records whether the ferry was on time (yes or no). Is this variable categorical or numerical? Explain briefly.

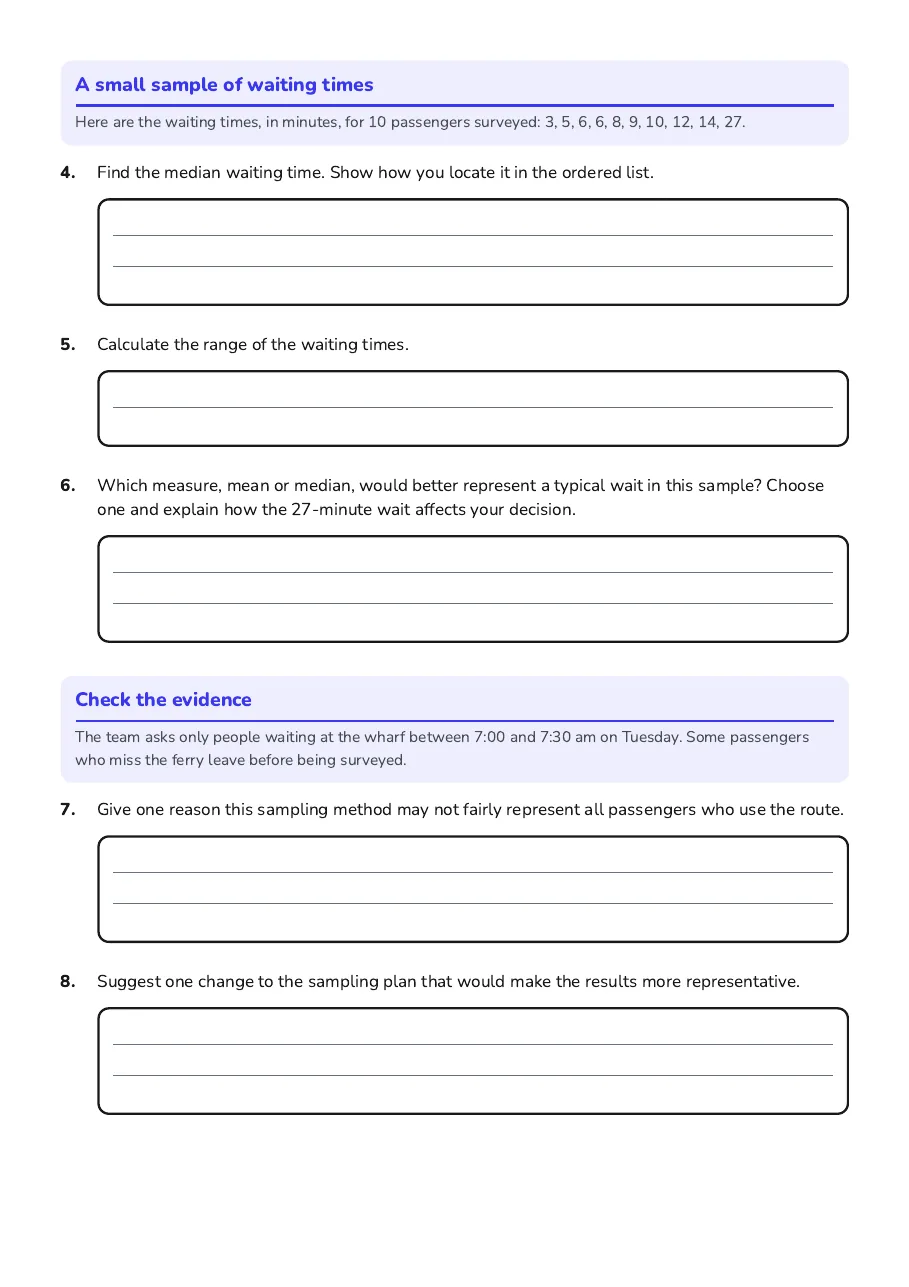
A small sample of waiting times

Here are the waiting times, in minutes, for 10 passengers surveyed: 3, 5, 6, 6, 8, 9, 10, 12, 14, 27.

4.Find the median waiting time. Show how you locate it in the ordered list.
5.Calculate the range of the waiting times.
6.Which measure, mean or median, would better represent a typical wait in this sample? Choose one and explain how the 27-minute wait affects your decision.

Check the evidence

The team asks only people waiting at the wharf between 7:00 and 7:30 am on Tuesday. Some passengers who miss the ferry leave before being surveyed.

7.Give one reason this sampling method may not fairly represent all passengers who use the route.
8.Suggest one change to the sampling plan that would make the results more representative.
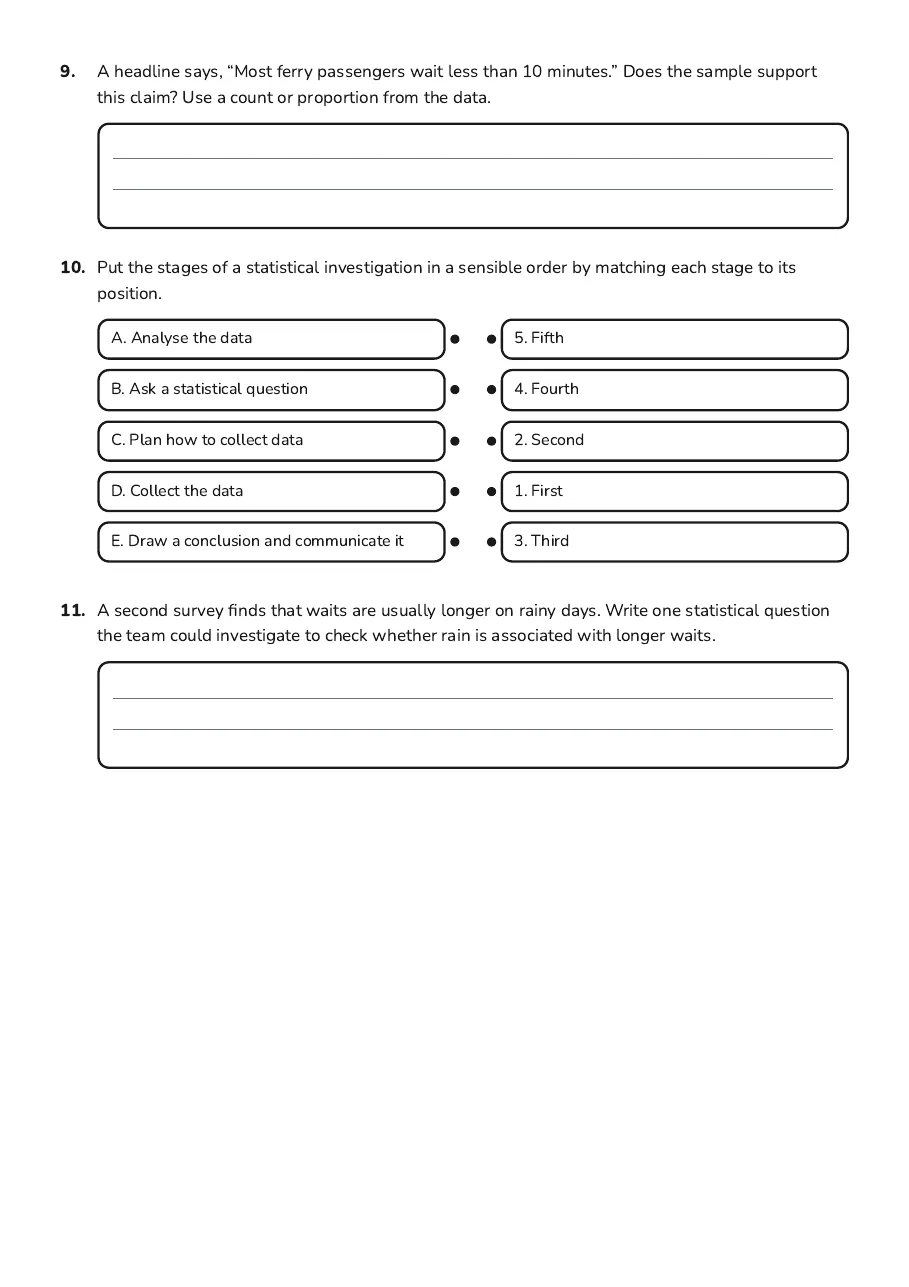
9.A headline says, “Most ferry passengers wait less than 10 minutes.” Does the sample support this claim? Use a count or proportion from the data.
10.Put the stages of a statistical investigation in a sensible order by matching each stage to its position.
  • A. Analyse the data
  • B. Ask a statistical question
  • C. Plan how to collect data
  • D. Collect the data
  • E. Draw a conclusion and communicate it
  • 5. Fifth
  • 4. Fourth
  • 2. Second
  • 1. First
  • 3. Third
11.A second survey finds that waits are usually longer on rainy days. Write one statistical question the team could investigate to check whether rain is associated with longer waits.

3 printable pages

  • Statistics Basics Introduction, page 1 of 3: Set up the investigation

    Page 1

  • Statistics Basics Introduction, page 2 of 3: A small sample of waiting times, Check the evidence

    Page 2

  • Statistics Basics Introduction, page 3 of 3: 9. A headline says, “Most ferry passengers wait less than 10 minutes.” Does the sample…

    Page 3

About This Worksheet

Free in Kuraplan

Sign up free, grab the PDF, and customize it for your class.

Print-Ready

Formatted for standard paper. Clean layout, easy to read.

AI-Generated

Created with Kuraplan's AI, designed for real classroom use.

For Teachers & Parents

Use in classrooms, for homework, tutoring, or homeschool.

Need a custom version of this worksheet?

Kuraplan's AI generates custom worksheets in seconds — differentiated for every learner, aligned to your curriculum.

Generate Custom Worksheets — Free
No credit card Curriculum-aligned Under 60 seconds