MathsFreePrintable

Statistics Introduction Basics

A free maths worksheet ready for your classroom. Open in Kuraplan to grab the print-ready PDF, customize it for your students, or generate a fresh version in seconds.
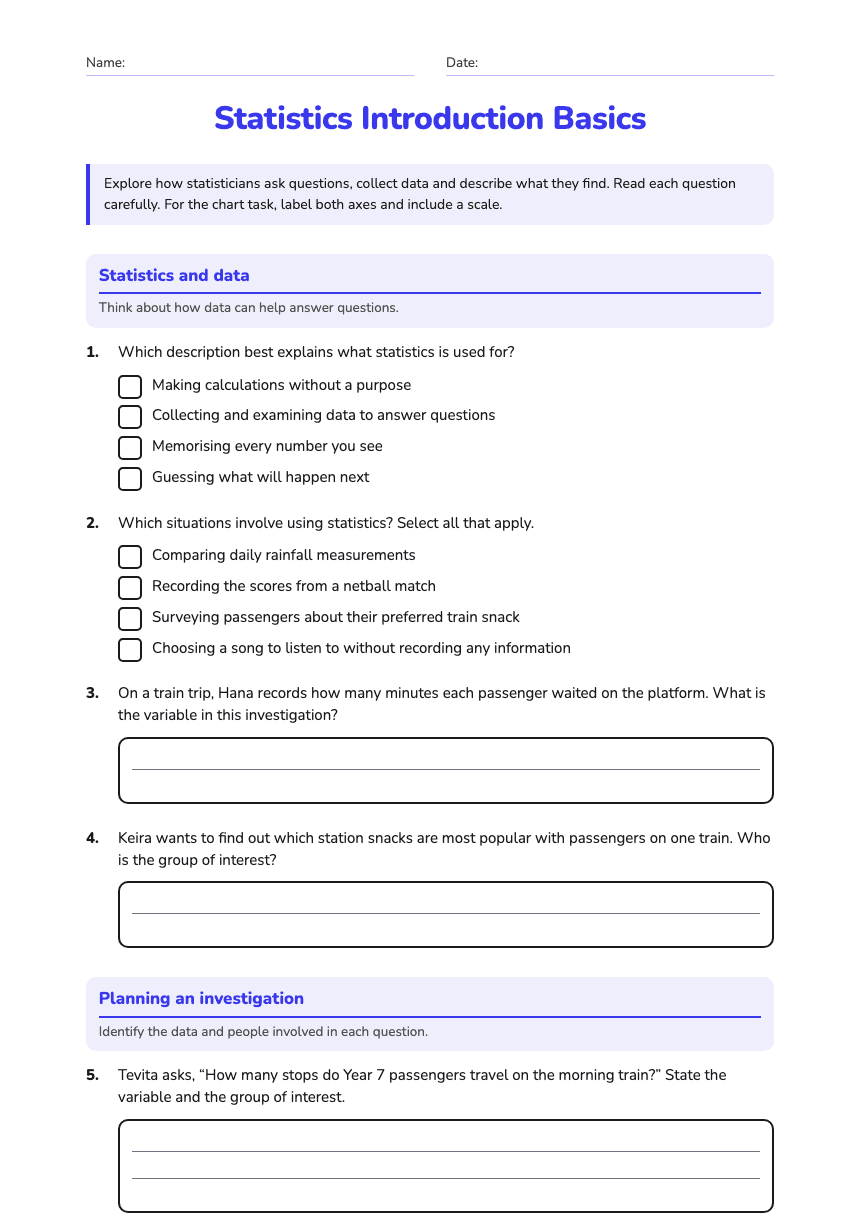
Statistics Introduction Basics worksheet preview
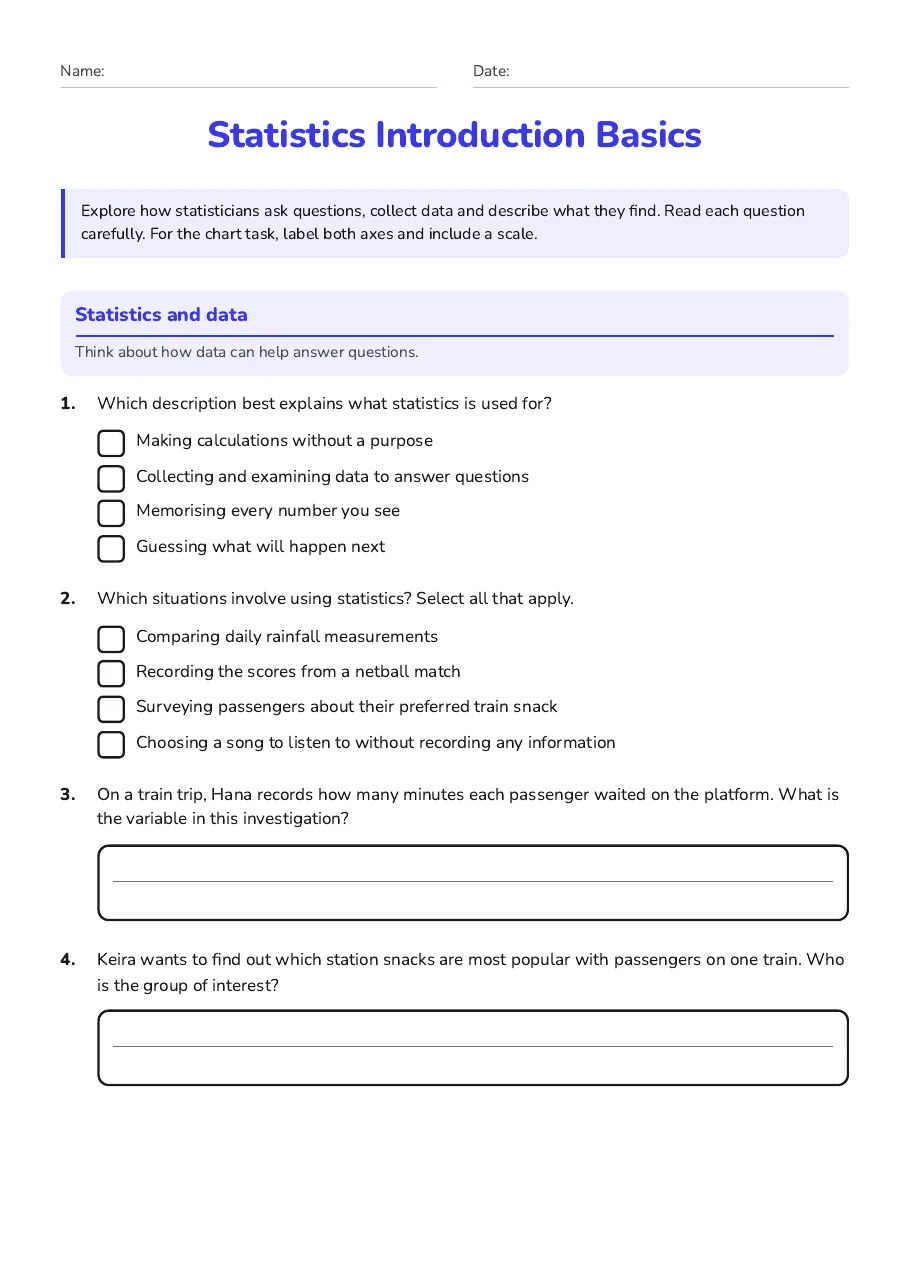
Name:Date:

Statistics Introduction Basics

Explore how statisticians ask questions, collect data and describe what they find. Read each question carefully. For the chart task, label both axes and include a scale.

Statistics and data

Think about how data can help answer questions.

1.Which description best explains what statistics is used for?
  • Making calculations without a purpose
  • Collecting and examining data to answer questions
  • Memorising every number you see
  • Guessing what will happen next
2.Which situations involve using statistics? Select all that apply.
  • Comparing daily rainfall measurements
  • Recording the scores from a netball match
  • Surveying passengers about their preferred train snack
  • Choosing a song to listen to without recording any information
3.On a train trip, Hana records how many minutes each passenger waited on the platform. What is the variable in this investigation?
4.Keira wants to find out which station snacks are most popular with passengers on one train. Who is the group of interest?

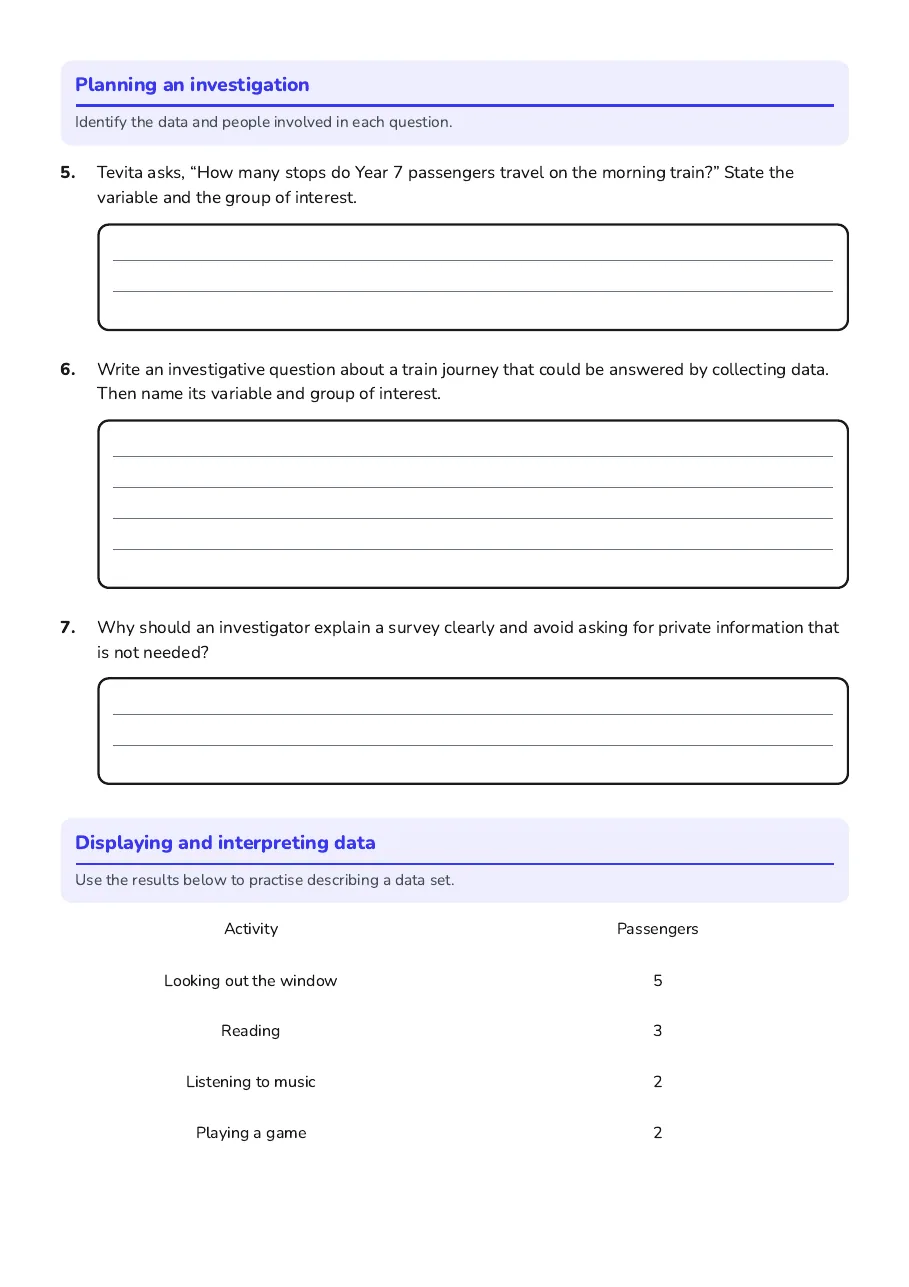
Planning an investigation

Identify the data and people involved in each question.

5.Tevita asks, “How many stops do Year 7 passengers travel on the morning train?” State the variable and the group of interest.
6.Write an investigative question about a train journey that could be answered by collecting data. Then name its variable and group of interest.
7.Why should an investigator explain a survey clearly and avoid asking for private information that is not needed?

Displaying and interpreting data

Use the results below to practise describing a data set.

Activity

Passengers

Looking out the window

5

Reading

3

Listening to music

2

Playing a game

2

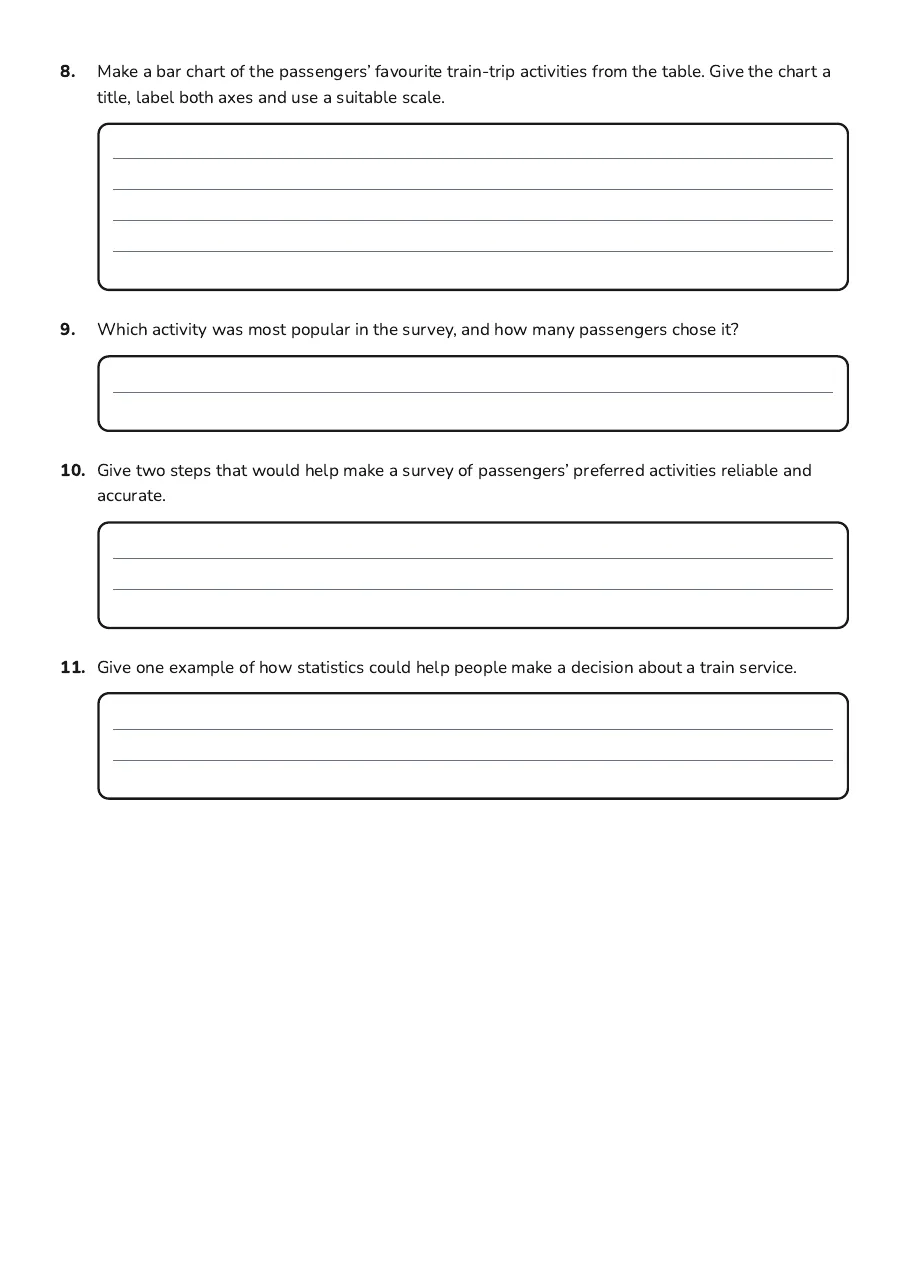
8.Make a bar chart of the passengers’ favourite train-trip activities from the table. Give the chart a title, label both axes and use a suitable scale.
9.Which activity was most popular in the survey, and how many passengers chose it?
10.Give two steps that would help make a survey of passengers’ preferred activities reliable and accurate.
11.Give one example of how statistics could help people make a decision about a train service.

3 printable pages

  • Statistics Introduction Basics, page 1 of 3: Statistics and data

    Page 1

  • Statistics Introduction Basics, page 2 of 3: Planning an investigation, Displaying and interpreting data

    Page 2

  • Statistics Introduction Basics, page 3 of 3: 8. Make a bar chart of the passengers’ favourite train-trip activities from the table.…

    Page 3

About This Worksheet

Free in Kuraplan

Sign up free, grab the PDF, and customize it for your class.

Print-Ready

Formatted for standard paper. Clean layout, easy to read.

AI-Generated

Created with Kuraplan's AI, designed for real classroom use.

For Teachers & Parents

Use in classrooms, for homework, tutoring, or homeschool.

Need a custom version of this worksheet?

Kuraplan's AI generates custom worksheets in seconds — differentiated for every learner, aligned to your curriculum.

Generate Custom Worksheets — Free
No credit card Curriculum-aligned Under 60 seconds