MathsFreePrintable
Statistics Investigation and Visualization
A free maths worksheet ready for your classroom. Open in Kuraplan to grab the print-ready PDF, customize it for your students, or generate a fresh version in seconds.
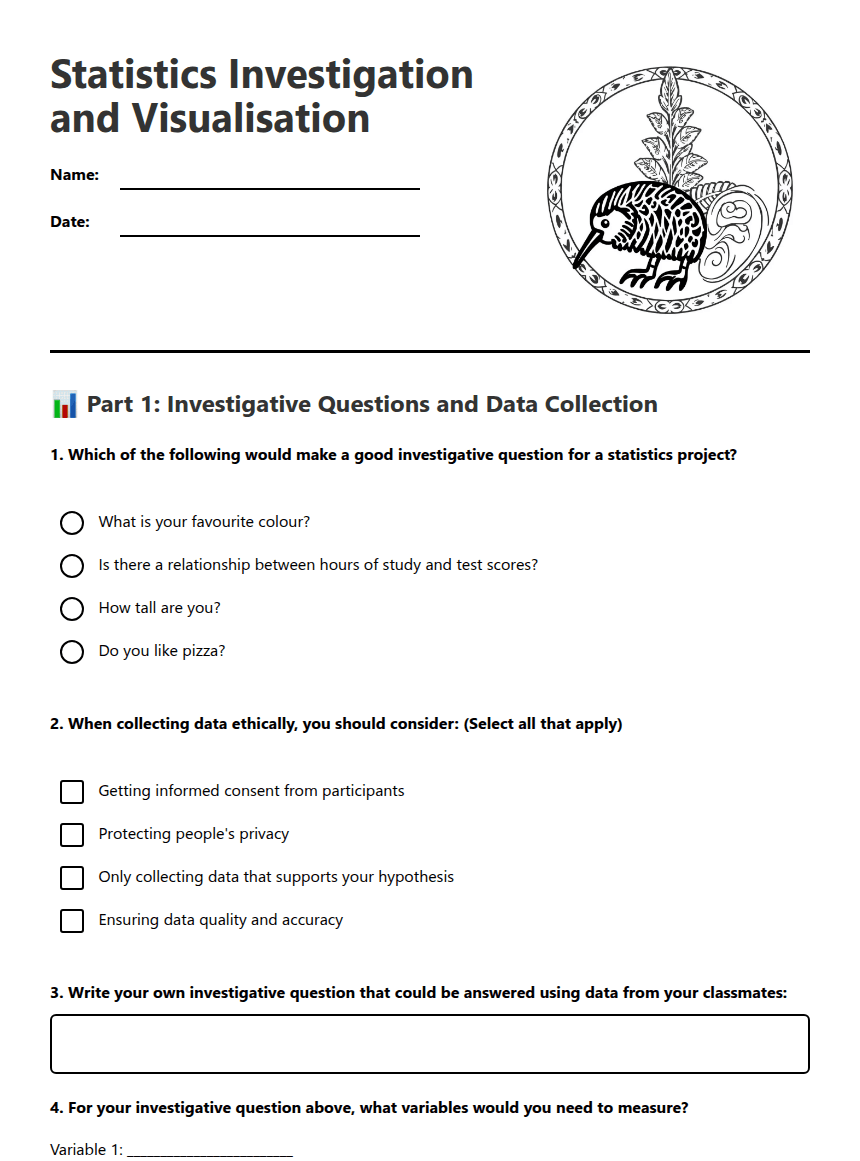
Statistics Investigation and Visualisation

📊 Part 1: Investigative Questions and Data Collection
1. Which of the following would make a good investigative question for a statistics project?
What is your favourite colour?
Is there a relationship between hours of study and test scores?
How tall are you?
Do you like pizza?
2. When collecting data ethically, you should consider: (Select all that apply)
Getting informed consent from participants
Protecting people's privacy
Only collecting data that supports your hypothesis
Ensuring data quality and accuracy
3. Write your own investigative question that could be answered using data from your classmates:
4. For your investigative question above, what variables would you need to measure?
Variable 1: _________________________
Variable 2: _________________________
📈 Part 2: Data Visualisation and Analysis
5. Match each type of data with the most appropriate visualisation:
Categorical data (favourite subjects)
One numerical variable (test scores)
Two numerical variables (height vs shoe size)
Scatter plot
Bar graph
Dot plot
6. When describing patterns in a scatter plot, which features should you look for?
Trends (positive or negative relationships)
Clusters of data points
Outliers (unusual data points)
The colour of the dots
7. A scatter plot shows the relationship between hours of sleep and test scores. If the points generally go from bottom-left to top-right, this suggests:
No relationship between sleep and test scores
More sleep is associated with higher test scores
More sleep is associated with lower test scores
The data is incorrect
8. Describe what you would look for when drawing a line of best fit on a scatter plot:
💬 Part 3: Communicating Statistical Findings
9. When presenting your statistical findings, you should include:
A summary of patterns found in the data
Comparison of your initial prediction with actual results
Only data that supports your original idea
Any limitations or concerns about your data
10. Imagine you investigated "Is there a relationship between time spent on social media and hours of sleep?" Write a brief conclusion based on finding that students who spend more time on social media tend to sleep fewer hours:
11. Why is it important to consider data quality and ethics when conducting statistical investigations?
About This Worksheet
Free in Kuraplan
Sign up free, grab the PDF, and customize it for your class.
Print-Ready
Formatted for standard paper. Clean layout, easy to read.
AI-Generated
Created with Kuraplan's AI, designed for real classroom use.
For Teachers & Parents
Use in classrooms, for homework, tutoring, or homeschool.
Need a custom version of this worksheet?
Kuraplan's AI generates custom worksheets in seconds — differentiated for every learner, aligned to your curriculum.
Generate Custom Worksheets — Free No credit card Curriculum-aligned Under 60 seconds







