MathsFreePrintable

Time-Series Data Answer Sheet

A free maths worksheet ready for your classroom. Open in Kuraplan to grab the print-ready PDF, customize it for your students, or generate a fresh version in seconds.
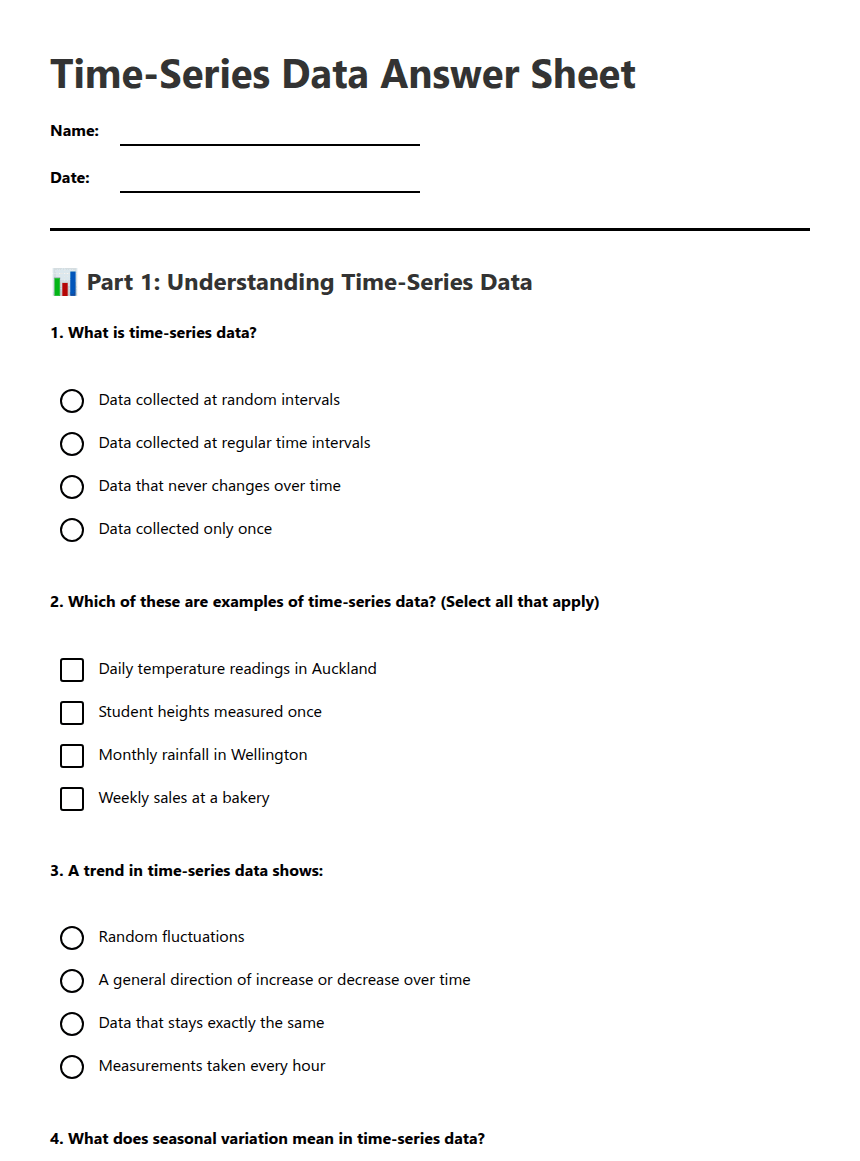
Time-Series Data Answer Sheet worksheet preview

Time-Series Data Answer Sheet

📊 Part 1: Understanding Time-Series Data

1. What is time-series data?

Data collected at random intervals

Data collected at regular time intervals (Correct) - Time-series data is specifically collected at consistent intervals to observe changes over time.

Data that never changes over time

Data collected only once

2. Which of these are examples of time-series data? (Select all that apply)

Daily temperature readings in Auckland (Correct)

Student heights measured once

Monthly rainfall in Wellington (Correct)

Weekly sales at a bakery (Correct)

3. A trend in time-series data shows:

Random fluctuations

A general direction of increase or decrease over time (Correct) - Trends indicate the overall movement in the data over a period.

Data that stays exactly the same

Measurements taken every hour

4. What does seasonal variation mean in time-series data?
Seasonal variation refers to predictable changes that occur at specific intervals, such as increased ice cream sales in summer.
5. Calculate the mean temperature for this week's data: Monday 18°C, Tuesday 20°C, Wednesday 19°C, Thursday 22°C, Friday 21°C
Mean = (18 + 20 + 19 + 22 + 21) / 5 = 100 / 5 = 20°C (Correct)

📋 Part 2: Planning Data Collection

6. You want to study how many students buy lunch from the canteen. What would be the best time interval for collecting this data?

Every minute

Daily (Correct) - Daily collection allows for a comprehensive view of student behavior.

Monthly

Yearly

7. List three factors you should consider when planning to collect time-series data:

a) Frequency of data collection (e.g., daily, weekly)

b) Duration of the study (e.g., how long will data be collected)

c) Type of data to be collected (e.g., qualitative vs. quantitative)

8. Why is it important to collect data at regular intervals?
Collecting data at regular intervals ensures consistency and allows for accurate trend analysis over time.

🔬 Part 3: Design Your Own Time-Series Study

9. Choose a topic for your own time-series study and complete the planning:

Topic: ________________________________

What will you measure? ________________________________

How often will you collect data? ________________________________

For how long? ________________________________

10. Predict what pattern or trend you might see in your data and explain why:
11. If you collected data on the number of cars passing your school each hour for one week, what might affect your results? List two factors:

1. Weather conditions (e.g., rain may reduce traffic)

2. School events (e.g., sports days may increase traffic)

About This Worksheet

Free in Kuraplan

Sign up free, grab the PDF, and customize it for your class.

Print-Ready

Formatted for standard paper. Clean layout, easy to read.

AI-Generated

Created with Kuraplan's AI, designed for real classroom use.

For Teachers & Parents

Use in classrooms, for homework, tutoring, or homeschool.

Need a custom version of this worksheet?

Kuraplan's AI generates custom worksheets in seconds — differentiated for every learner, aligned to your curriculum.

Generate Custom Worksheets — Free


No credit card Curriculum-aligned Under 60 seconds





