Time-Series Data Worksheet
A free maths worksheet ready for your classroom. Open in Kuraplan to grab the print-ready PDF, customize it for your students, or generate a fresh version in seconds.
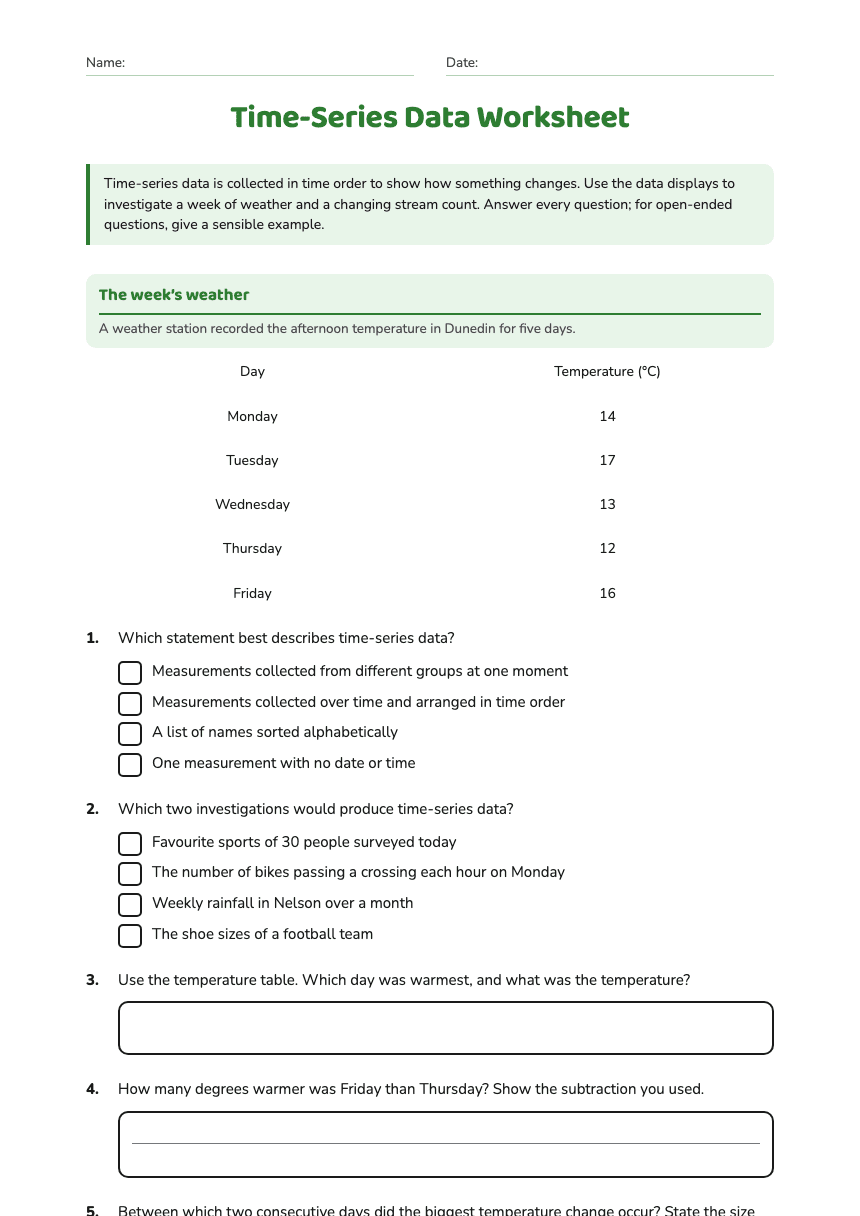
Time-Series Data Worksheet
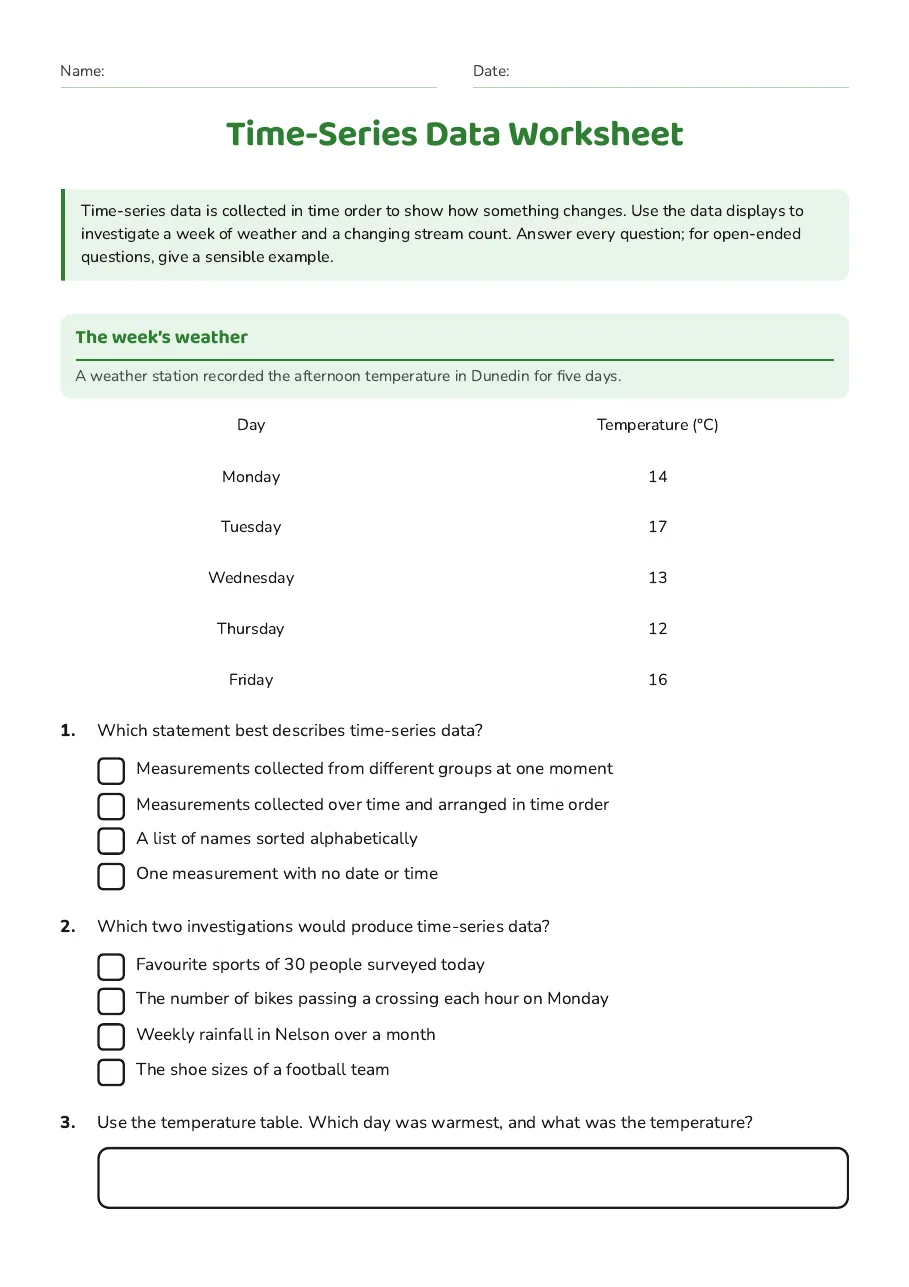
The week’s weather
A weather station recorded the afternoon temperature in Dunedin for five days.
Day
Temperature (°C)
Monday
14
Tuesday
17
Wednesday
13
Thursday
12
Friday
16
- Measurements collected from different groups at one moment
- Measurements collected over time and arranged in time order
- A list of names sorted alphabetically
- One measurement with no date or time
- Favourite sports of 30 people surveyed today
- The number of bikes passing a crossing each hour on Monday
- Weekly rainfall in Nelson over a month
- The shoe sizes of a football team
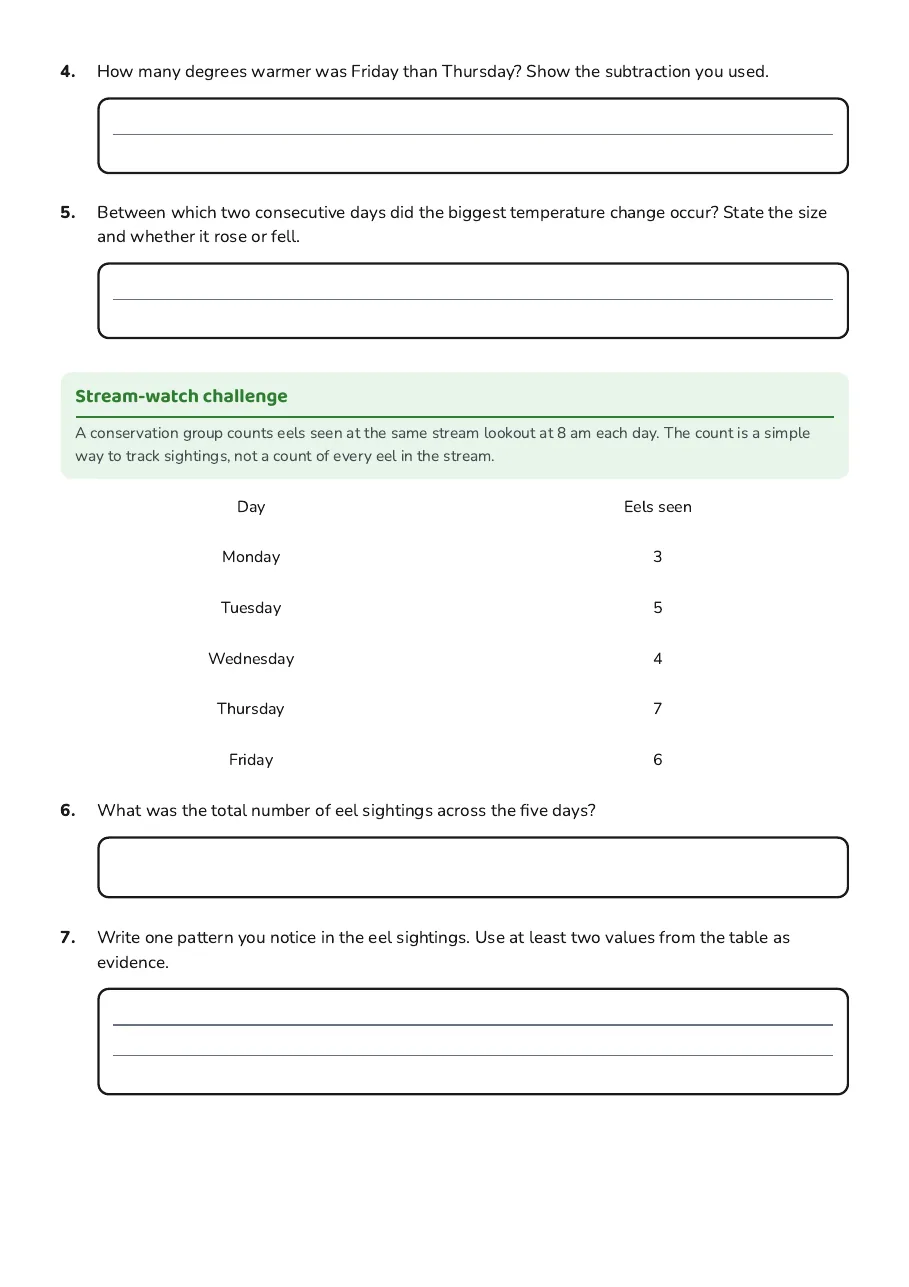
Stream-watch challenge
A conservation group counts eels seen at the same stream lookout at 8 am each day. The count is a simple way to track sightings, not a count of every eel in the stream.
Day
Eels seen
Monday
3
Tuesday
5
Wednesday
4
Thursday
7
Friday
6
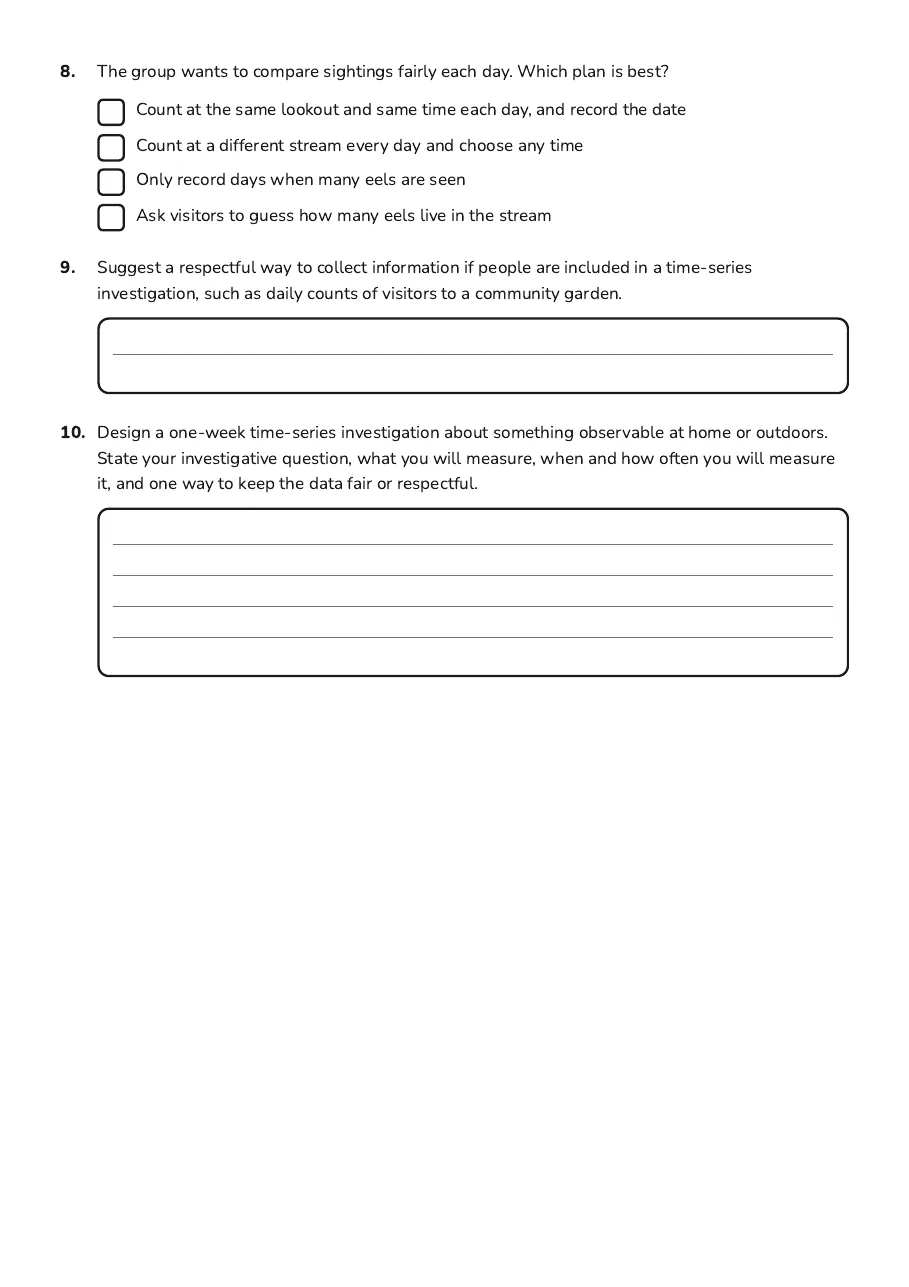
- Count at the same lookout and same time each day, and record the date
- Count at a different stream every day and choose any time
- Only record days when many eels are seen
- Ask visitors to guess how many eels live in the stream
3 printable pages
Page 1
Page 2
Page 3
About This Worksheet
Free in Kuraplan
Sign up free, grab the PDF, and customize it for your class.
Print-Ready
Formatted for standard paper. Clean layout, easy to read.
AI-Generated
Created with Kuraplan's AI, designed for real classroom use.
For Teachers & Parents
Use in classrooms, for homework, tutoring, or homeschool.
Need a custom version of this worksheet?
Kuraplan's AI generates custom worksheets in seconds — differentiated for every learner, aligned to your curriculum.
Generate Custom Worksheets — Free