Two Dice Probability Charts
A free maths worksheet ready for your classroom. Open in Kuraplan to grab the print-ready PDF, customize it for your students, or generate a fresh version in seconds.
Two Dice Probability Charts
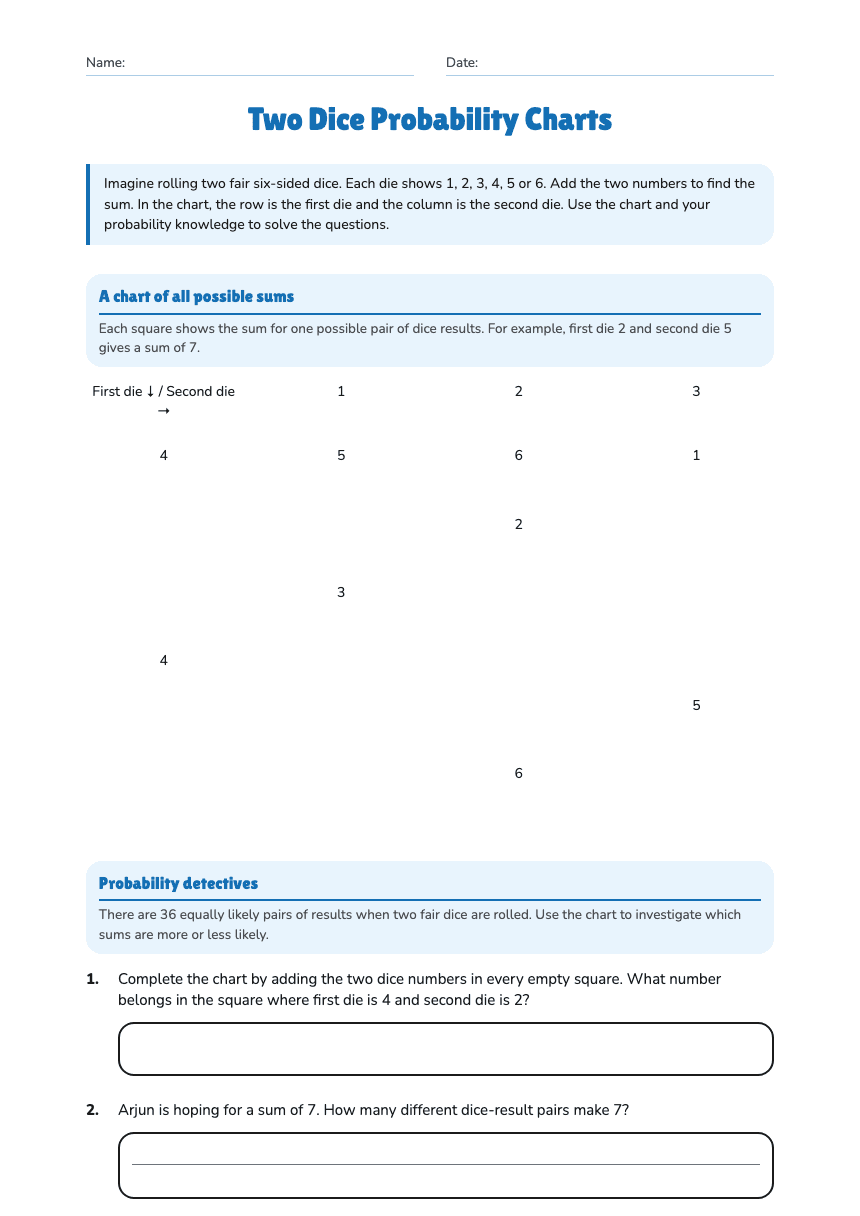
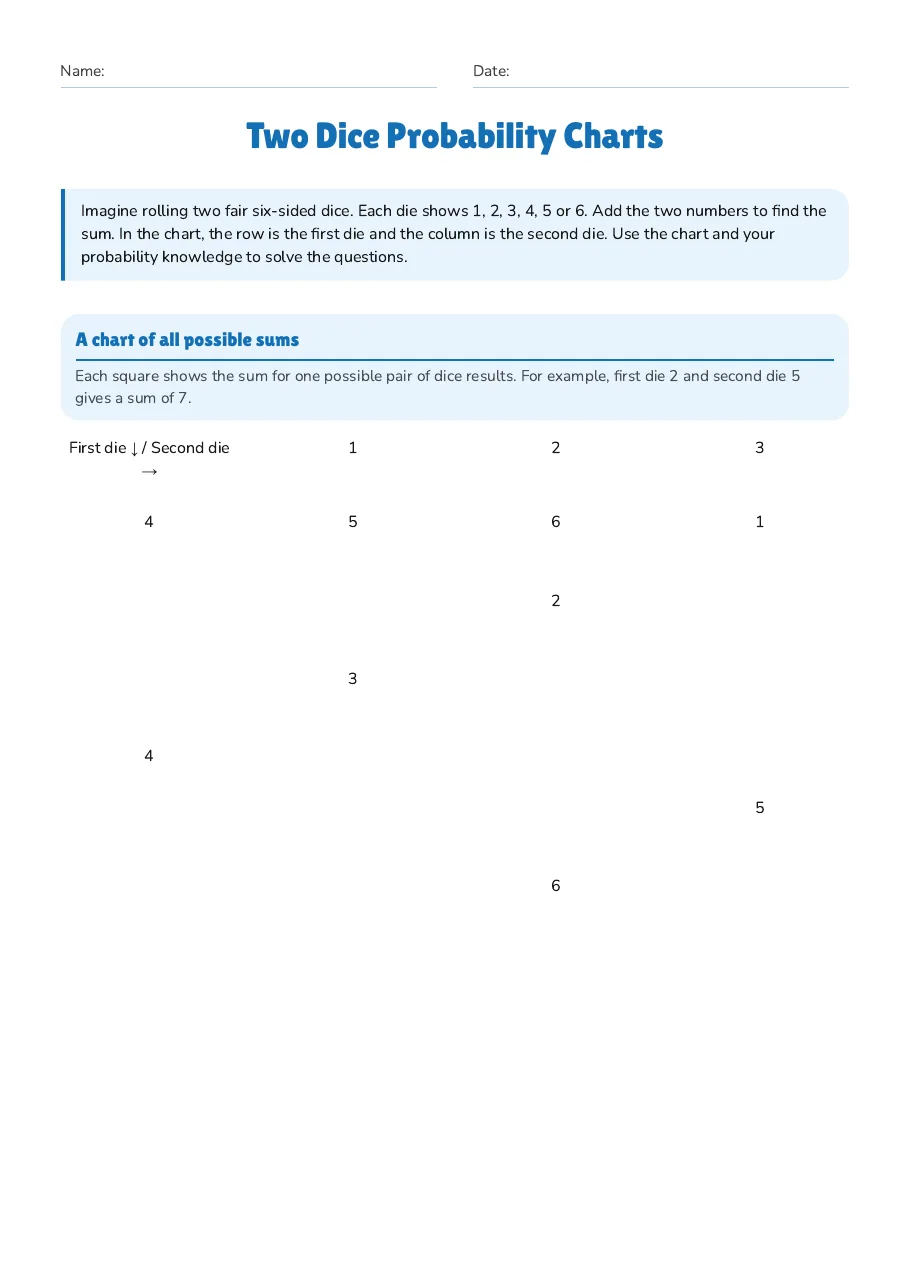
A chart of all possible sums
Each square shows the sum for one possible pair of dice results. For example, first die 2 and second die 5 gives a sum of 7.
First die ↓ / Second die →
1
2
3
4
5
6
1
2
3
4
5
6
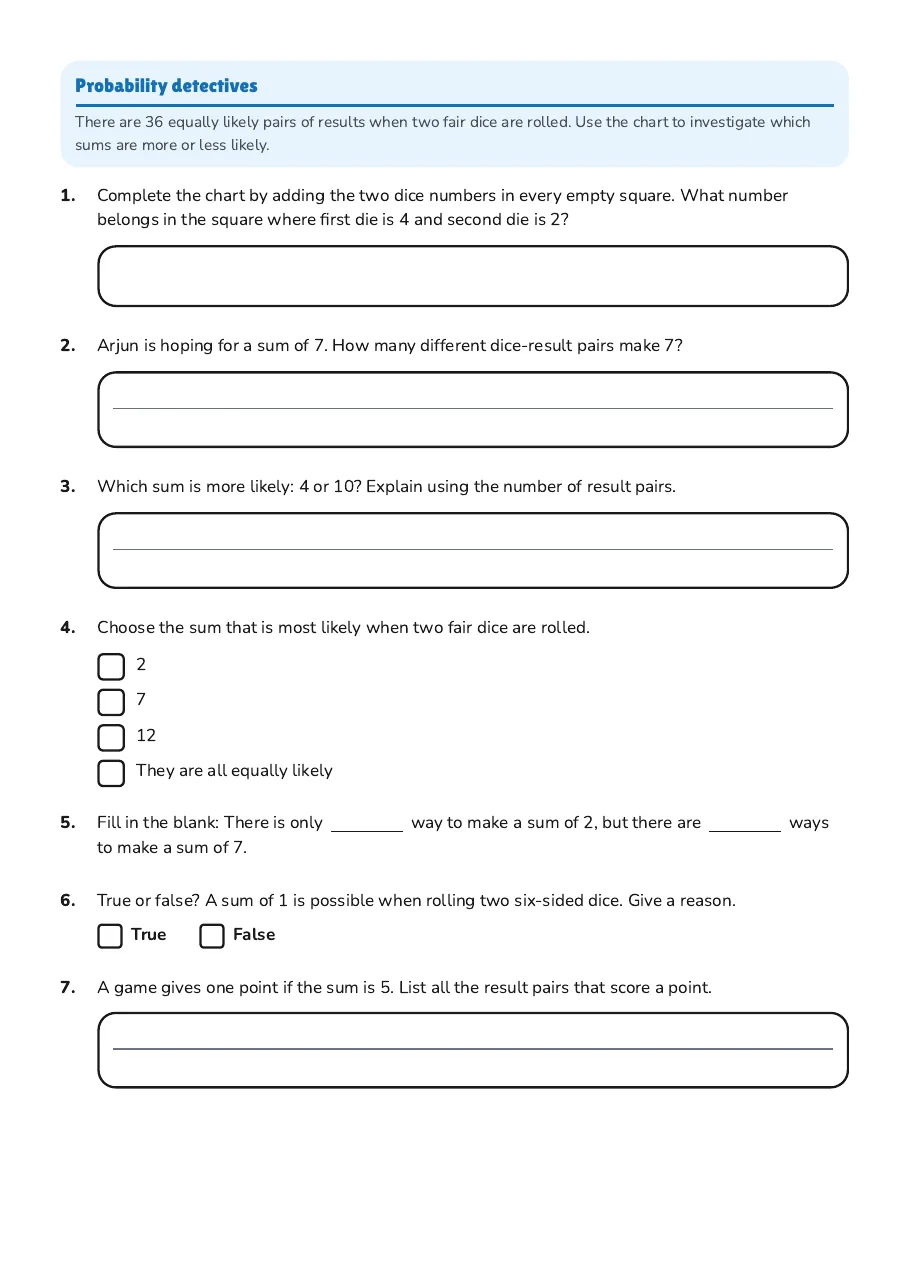
Probability detectives
There are 36 equally likely pairs of results when two fair dice are rolled. Use the chart to investigate which sums are more or less likely.
- 2
- 7
- 12
- They are all equally likely
3 printable pages
Page 1
Page 2
Page 3
About This Worksheet
Free in Kuraplan
Sign up free, grab the PDF, and customize it for your class.
Print-Ready
Formatted for standard paper. Clean layout, easy to read.
AI-Generated
Created with Kuraplan's AI, designed for real classroom use.
For Teachers & Parents
Use in classrooms, for homework, tutoring, or homeschool.
Need a custom version of this worksheet?
Kuraplan's AI generates custom worksheets in seconds — differentiated for every learner, aligned to your curriculum.
Generate Custom Worksheets — Free