MathsFreePrintable

Understanding Data Sets Worksheet

A free maths worksheet ready for your classroom. Open in Kuraplan to grab the print-ready PDF, customize it for your students, or generate a fresh version in seconds.
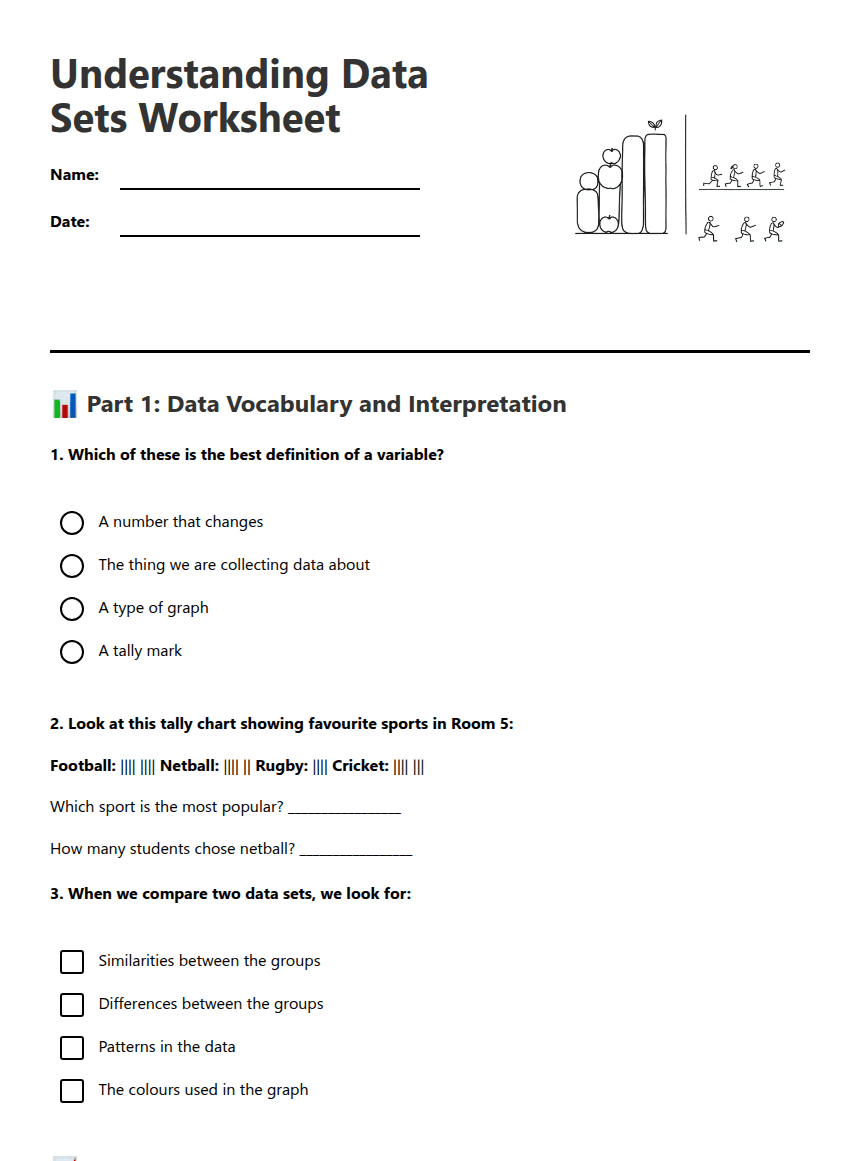
Understanding Data Sets Worksheet worksheet preview
Understanding Data Sets Worksheet

Data charts and graphs illustration

📊 Part 1: Data Vocabulary and Interpretation

1. Which of these is the best definition of a variable?

A number that changes

The thing we are collecting data about

A type of graph

A tally mark

2. Look at this tally chart showing favourite sports in Room 5:

Football: |||| |||| Netball: |||| || Rugby: |||| Cricket: |||| |||

Which sport is the most popular? _________________

How many students chose netball? _________________

3. When we compare two data sets, we look for:

Similarities between the groups

Differences between the groups

Patterns in the data

The colours used in the graph

📈 Part 2: Data Analysis and Patterns

4. Study the bar graph below showing favourite fruits for Year 4 boys and girls:

Imagine a bar graph showing: Boys - Apples: 8, Bananas: 5, Oranges: 3, Grapes: 6

Girls - Apples: 6, Bananas: 8, Oranges: 4, Grapes: 5

What pattern do you notice when comparing boys' and girls' choices?

5. Based on the data above, write a conclusion about which fruit is most popular overall:
6. The group of interest in this bar graph is:

Different types of fruit

Year 4 students

Boys and girls

The number of votes

🤔 Part 3: Drawing Conclusions and Communication

7. Sarah says "More boys like apples than any other fruit, so apples are the best fruit." Is this a good conclusion? Explain why or why not:
8. Write an investigative question you could ask about pets owned by students in different classes:
9. If you were presenting data findings to your class, which of these would help you communicate clearly?

Use statistical vocabulary correctly

Speak in complete sentences

Point to specific parts of the graph

Only talk about your favourite result

10. Complete this sentence using data vocabulary: "When I _________ the two bar graphs, I can see a _________ that shows girls prefer bananas more than boys do."

About This Worksheet

Free in Kuraplan

Sign up free, grab the PDF, and customize it for your class.

Print-Ready

Formatted for standard paper. Clean layout, easy to read.

AI-Generated

Created with Kuraplan's AI, designed for real classroom use.

For Teachers & Parents

Use in classrooms, for homework, tutoring, or homeschool.

Need a custom version of this worksheet?

Kuraplan's AI generates custom worksheets in seconds — differentiated for every learner, aligned to your curriculum.

Generate Custom Worksheets — Free


No credit card Curriculum-aligned Under 60 seconds





