MathsFreePrintable
Understanding Variables in Statistics
A free maths worksheet ready for your classroom. Open in Kuraplan to grab the print-ready PDF, customize it for your students, or generate a fresh version in seconds.
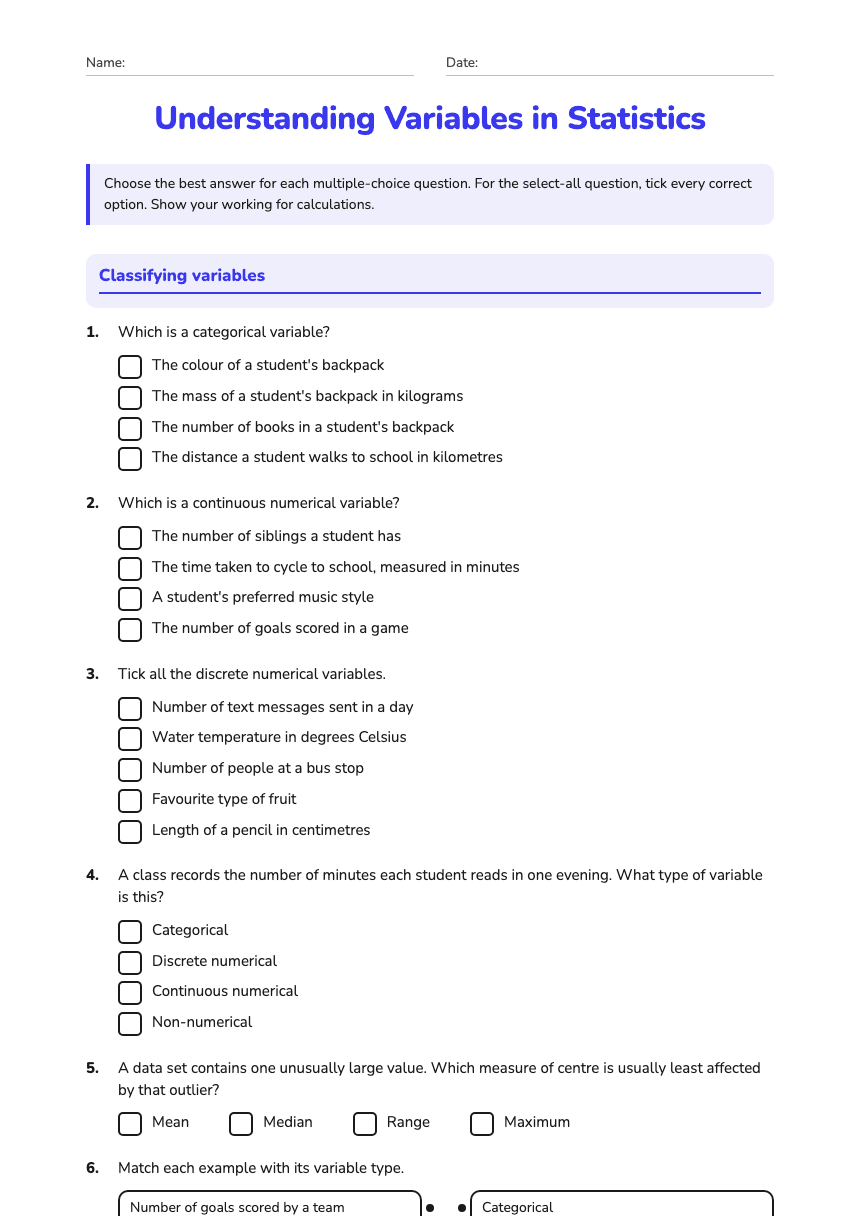
Name:Date:
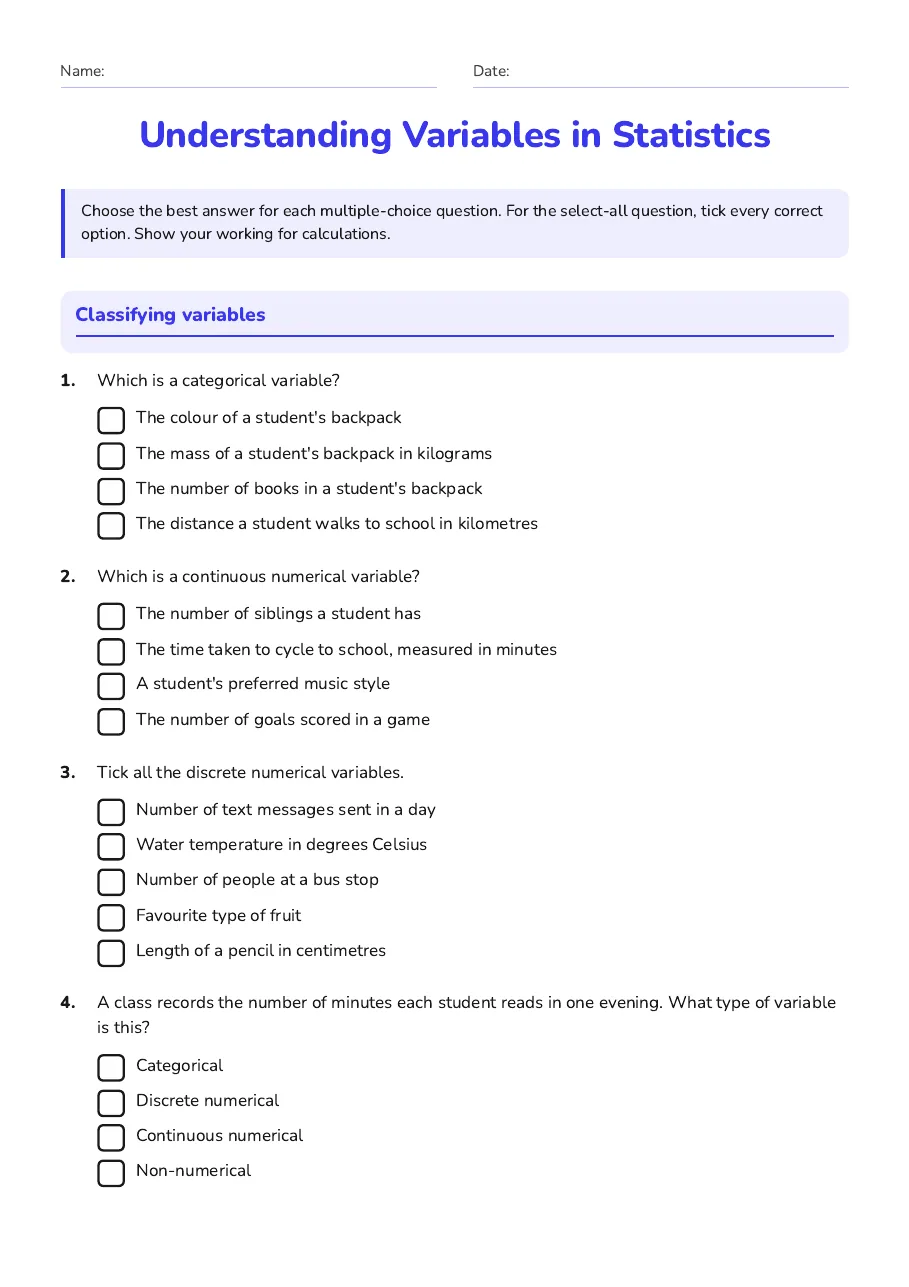
Understanding Variables in Statistics
Choose the best answer for each multiple-choice question. For the select-all question, tick every correct option. Show your working for calculations.
Classifying variables
1.Which is a categorical variable?
- The colour of a student's backpack
- The mass of a student's backpack in kilograms
- The number of books in a student's backpack
- The distance a student walks to school in kilometres
2.Which is a continuous numerical variable?
- The number of siblings a student has
- The time taken to cycle to school, measured in minutes
- A student's preferred music style
- The number of goals scored in a game
3.Tick all the discrete numerical variables.
- Number of text messages sent in a day
- Water temperature in degrees Celsius
- Number of people at a bus stop
- Favourite type of fruit
- Length of a pencil in centimetres
4.A class records the number of minutes each student reads in one evening. What type of variable is this?
- Categorical
- Discrete numerical
- Continuous numerical
- Non-numerical
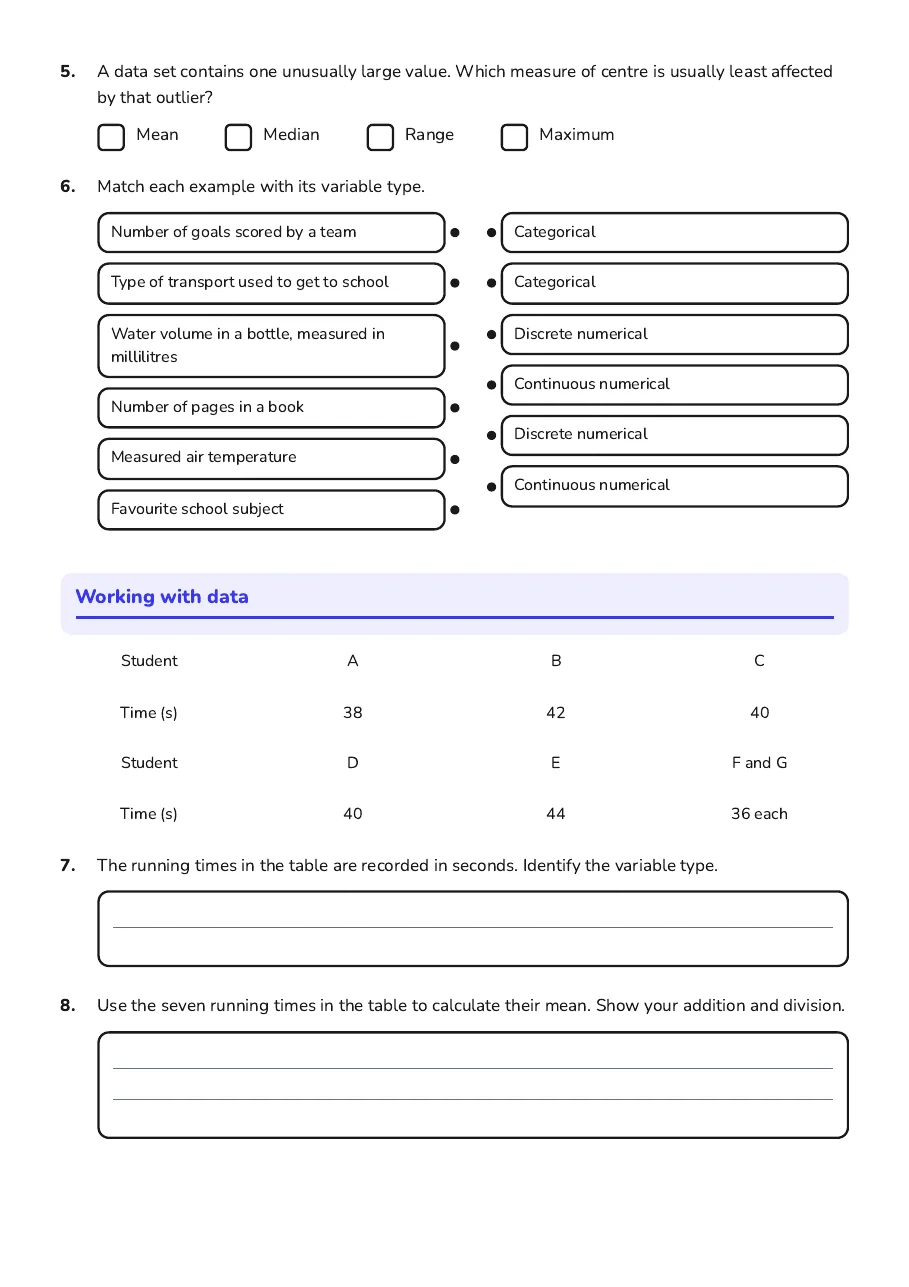
5.A data set contains one unusually large value. Which measure of centre is usually least affected by that outlier?
- Mean
- Median
- Range
- Maximum
6.Match each example with its variable type.
- Number of goals scored by a team
- Type of transport used to get to school
- Water volume in a bottle, measured in millilitres
- Number of pages in a book
- Measured air temperature
- Favourite school subject
- Categorical
- Categorical
- Discrete numerical
- Continuous numerical
- Discrete numerical
- Continuous numerical
Working with data
Student
A
B
C
Time (s)
38
42
40
Student
D
E
F and G
Time (s)
40
44
36 each
7.The running times in the table are recorded in seconds. Identify the variable type.
8.Use the seven running times in the table to calculate their mean. Show your addition and division.
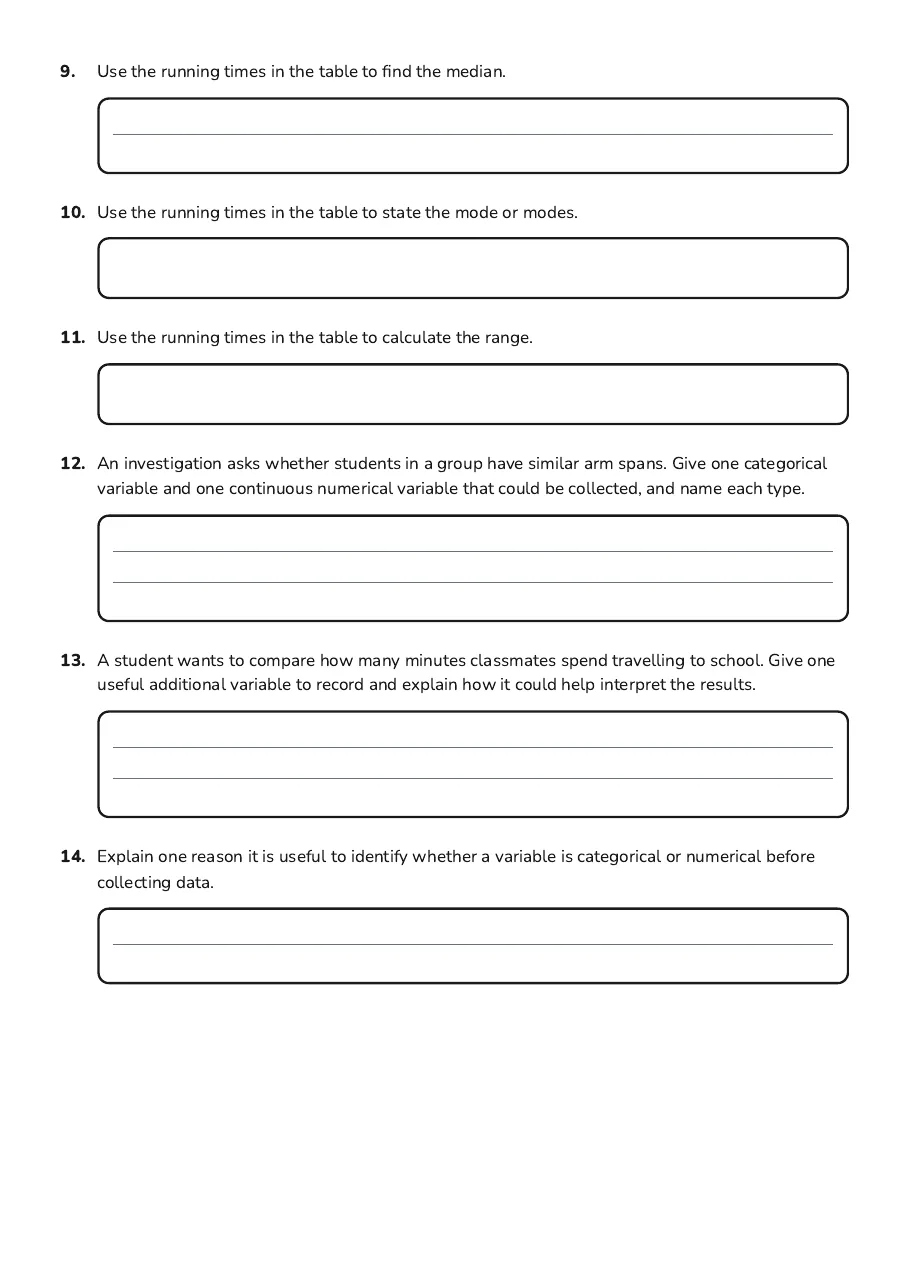
9.Use the running times in the table to find the median.
10.Use the running times in the table to state the mode or modes.
11.Use the running times in the table to calculate the range.
12.An investigation asks whether students in a group have similar arm spans. Give one categorical variable and one continuous numerical variable that could be collected, and name each type.
13.A student wants to compare how many minutes classmates spend travelling to school. Give one useful additional variable to record and explain how it could help interpret the results.
14.Explain one reason it is useful to identify whether a variable is categorical or numerical before collecting data.
3 printable pages
Page 1
Page 2
Page 3
About This Worksheet
Free in Kuraplan
Sign up free, grab the PDF, and customize it for your class.
Print-Ready
Formatted for standard paper. Clean layout, easy to read.
AI-Generated
Created with Kuraplan's AI, designed for real classroom use.
For Teachers & Parents
Use in classrooms, for homework, tutoring, or homeschool.
Need a custom version of this worksheet?
Kuraplan's AI generates custom worksheets in seconds — differentiated for every learner, aligned to your curriculum.
Generate Custom Worksheets — Free No credit card Curriculum-aligned Under 60 seconds