Proportional Tables Rate Practice
A free mathematics worksheet ready for your classroom. Open in Kuraplan to grab the print-ready PDF, customize it for your students, or generate a fresh version in seconds.
Proportional Tables Rate Practice
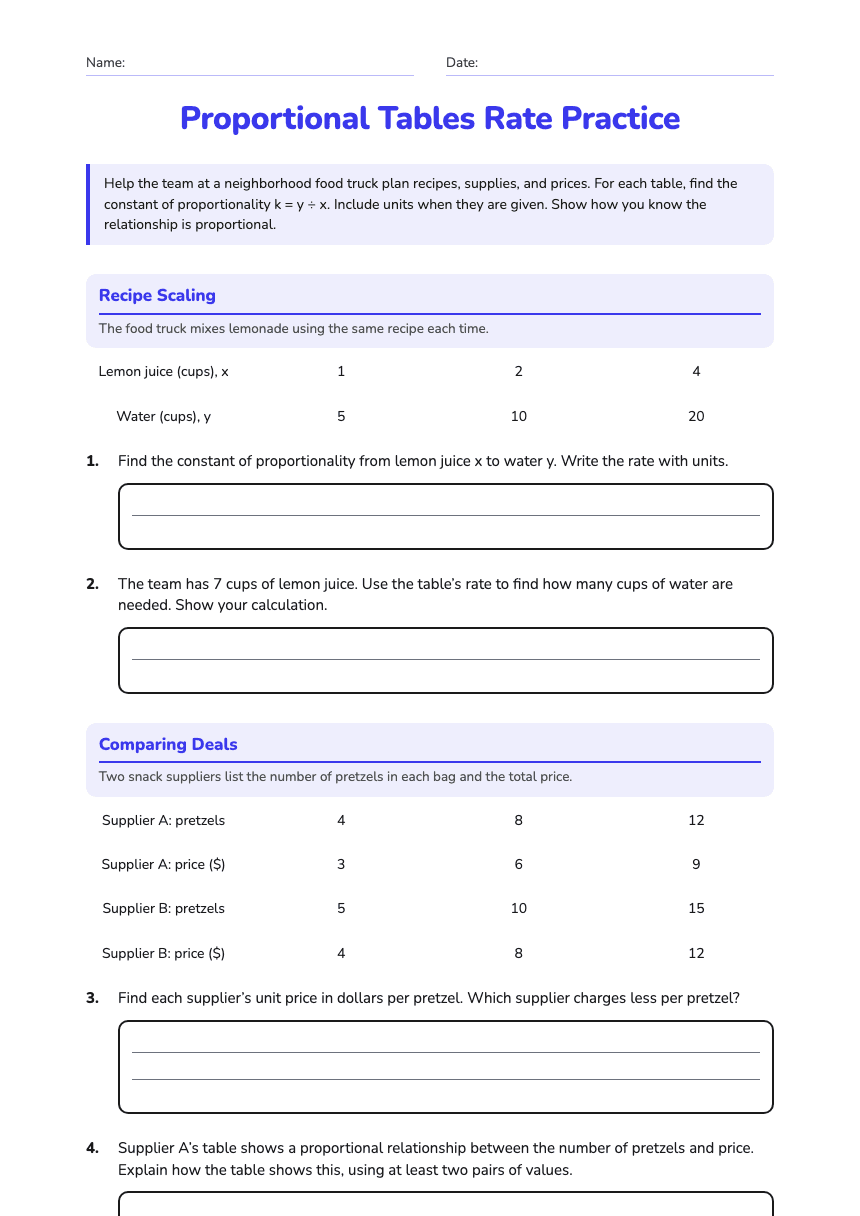
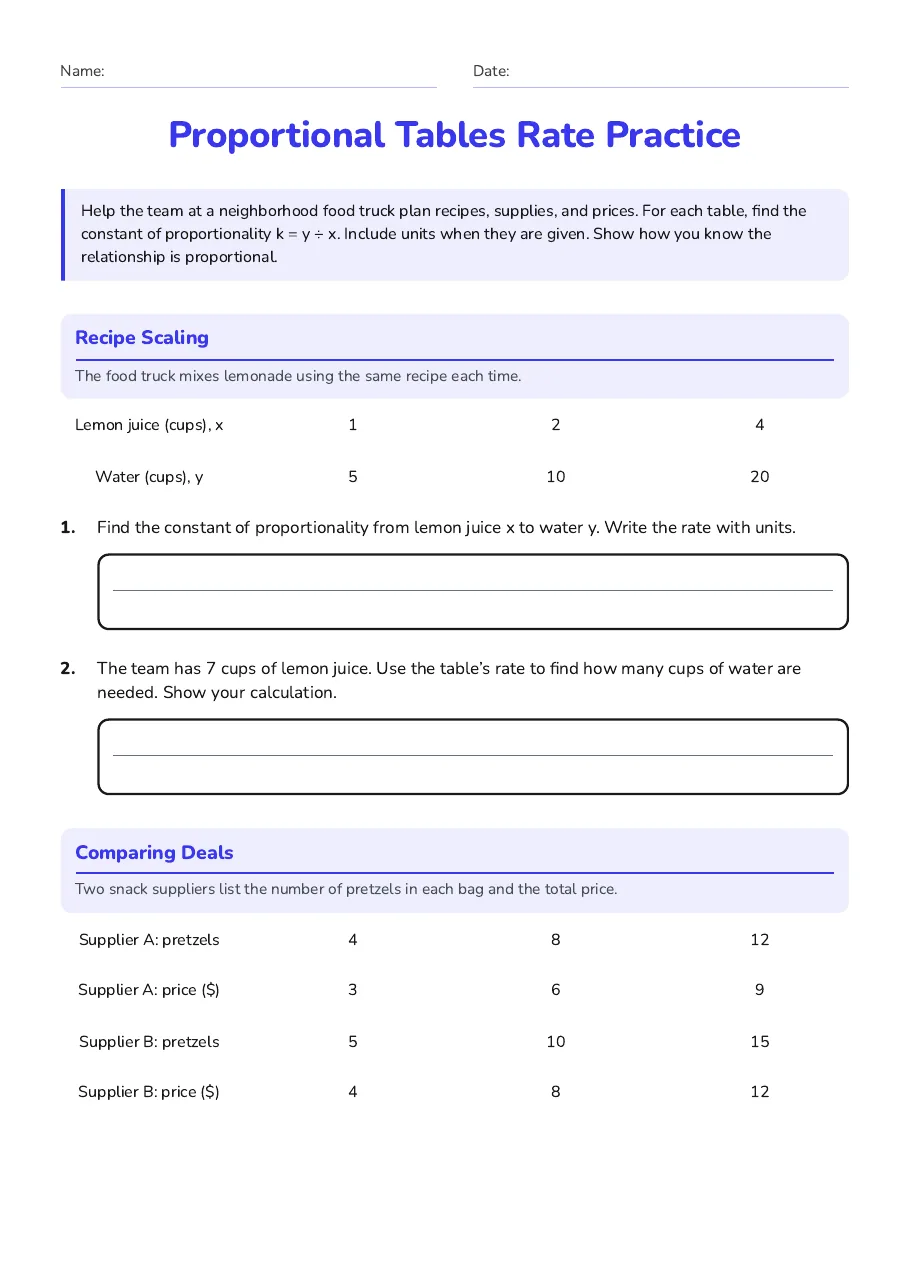
Recipe Scaling
The food truck mixes lemonade using the same recipe each time.
Lemon juice (cups), x
1
2
4
Water (cups), y
5
10
20
Comparing Deals
Two snack suppliers list the number of pretzels in each bag and the total price.
Supplier A: pretzels
4
8
12
Supplier A: price ($)
3
6
9
Supplier B: pretzels
5
10
15
Supplier B: price ($)
4
8
12
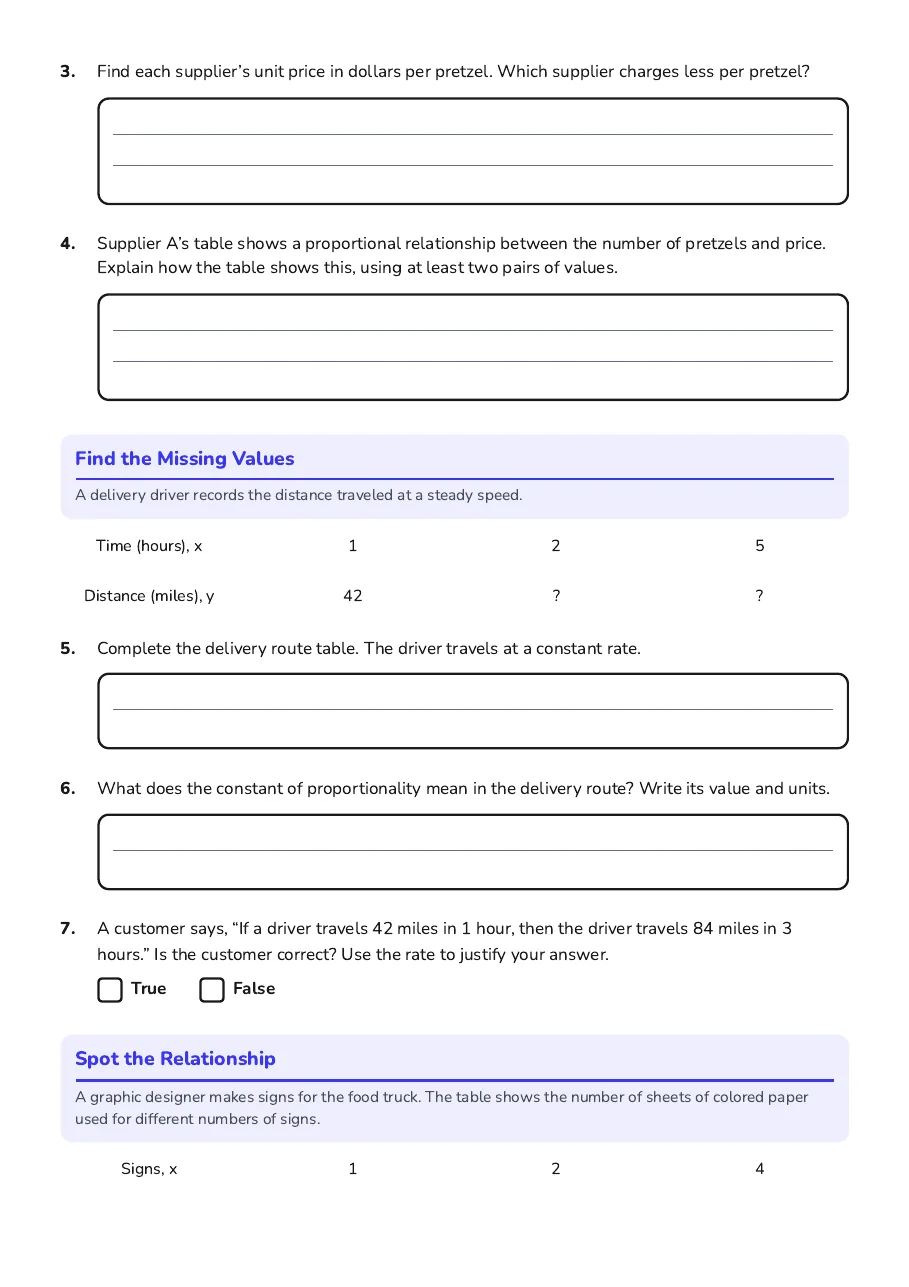
Find the Missing Values
A delivery driver records the distance traveled at a steady speed.
Time (hours), x
1
2
5
Distance (miles), y
42
?
?
Spot the Relationship
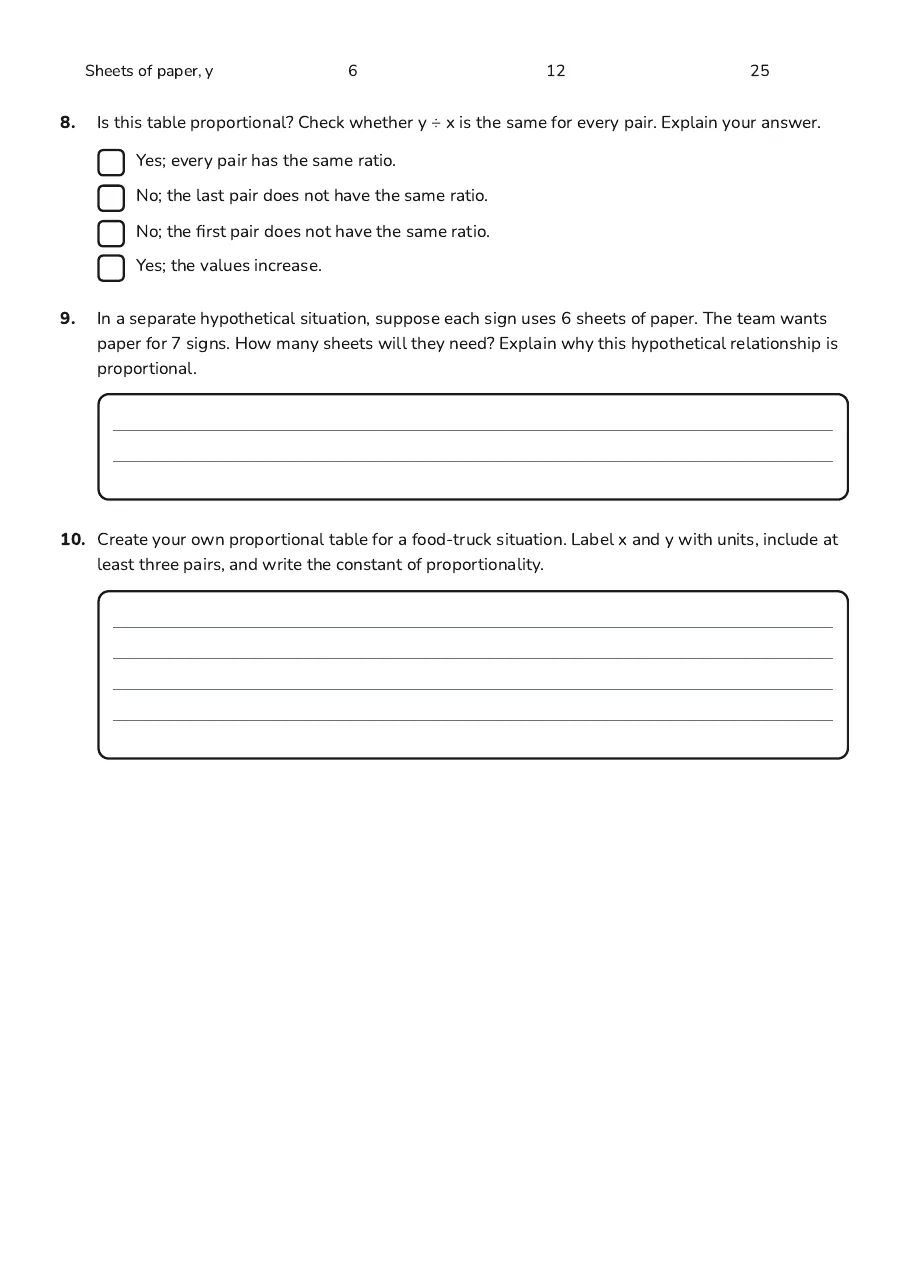
A graphic designer makes signs for the food truck. The table shows the number of sheets of colored paper used for different numbers of signs.
Signs, x
1
2
4
Sheets of paper, y
6
12
25
- Yes; every pair has the same ratio.
- No; the last pair does not have the same ratio.
- No; the first pair does not have the same ratio.
- Yes; the values increase.
3 printable pages
Page 1
Page 2
Page 3
About This Worksheet
Free in Kuraplan
Sign up free, grab the PDF, and customize it for your class.
Print-Ready
Formatted for standard paper. Clean layout, easy to read.
AI-Generated
Created with Kuraplan's AI, designed for real classroom use.
For Teachers & Parents
Use in classrooms, for homework, tutoring, or homeschool.
Need a custom version of this worksheet?
Kuraplan's AI generates custom worksheets in seconds — differentiated for every learner, aligned to your curriculum.
Generate Custom Worksheets — FreeMore Mathematics Worksheets
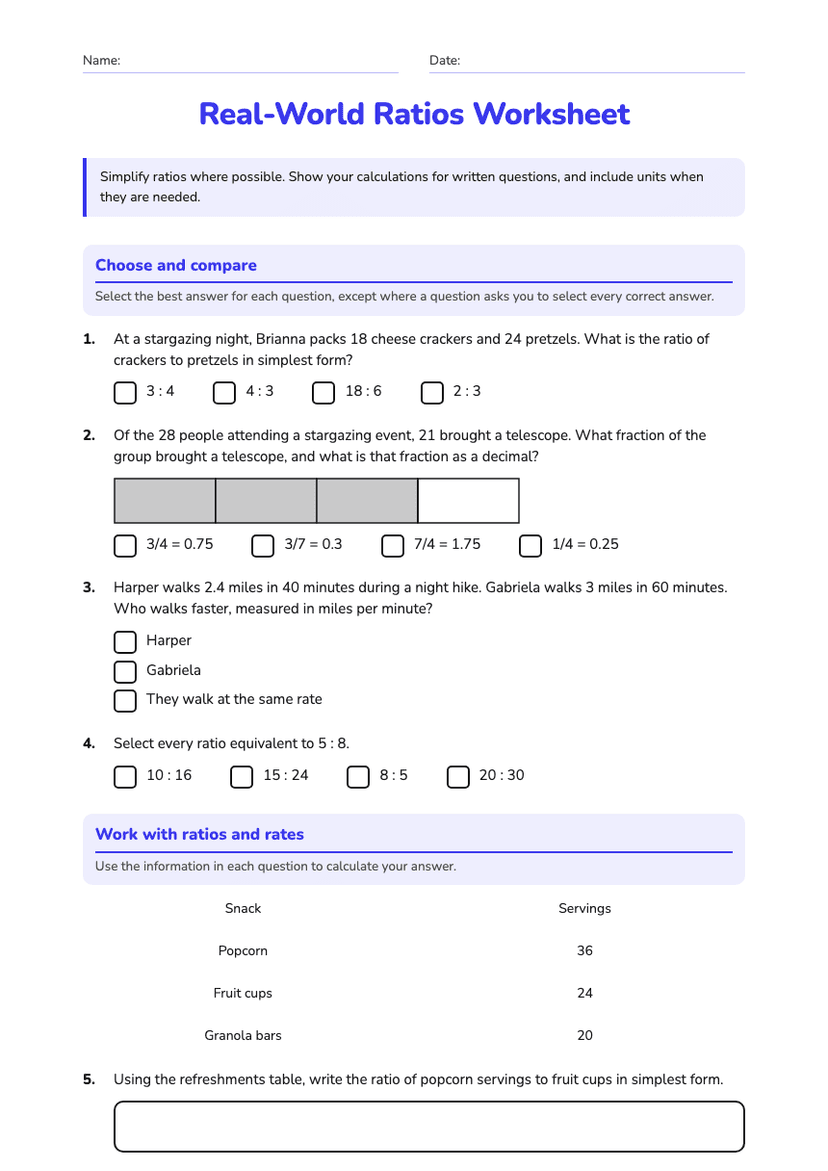
Real-World Ratios Worksheet
Free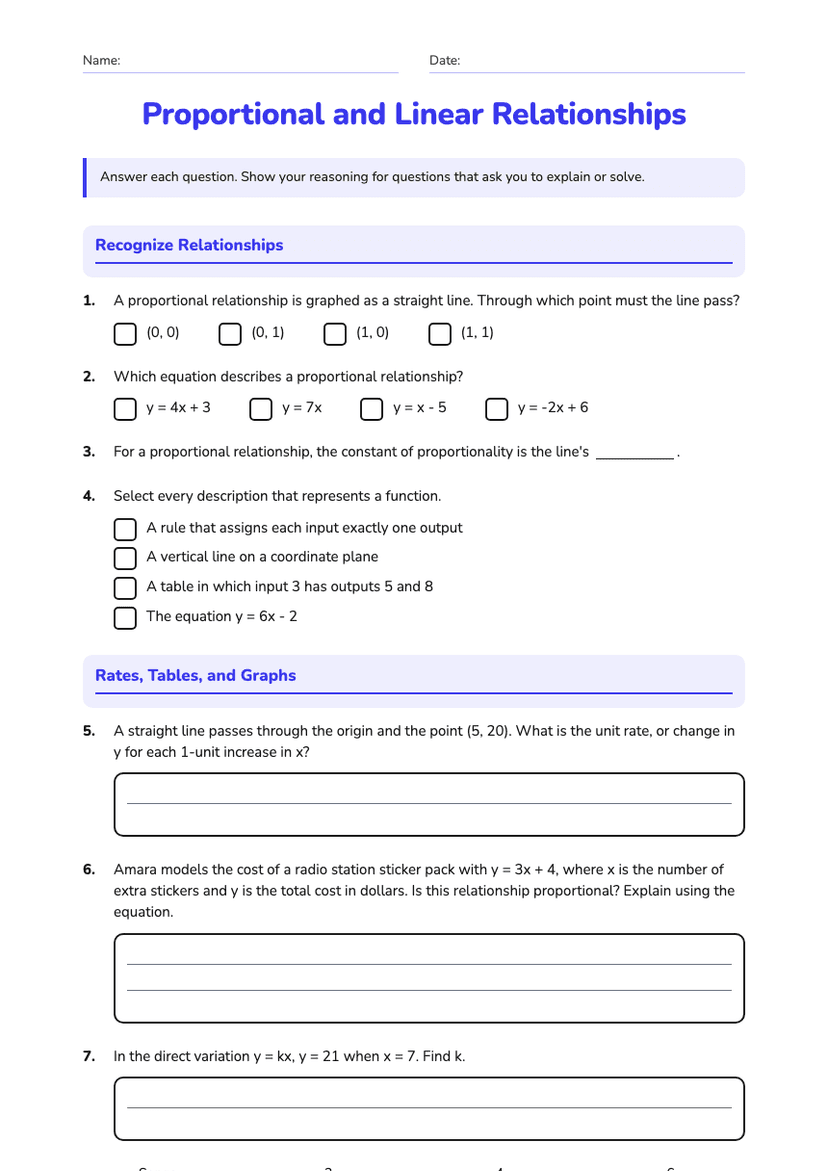
Proportional and Linear Relationships
Free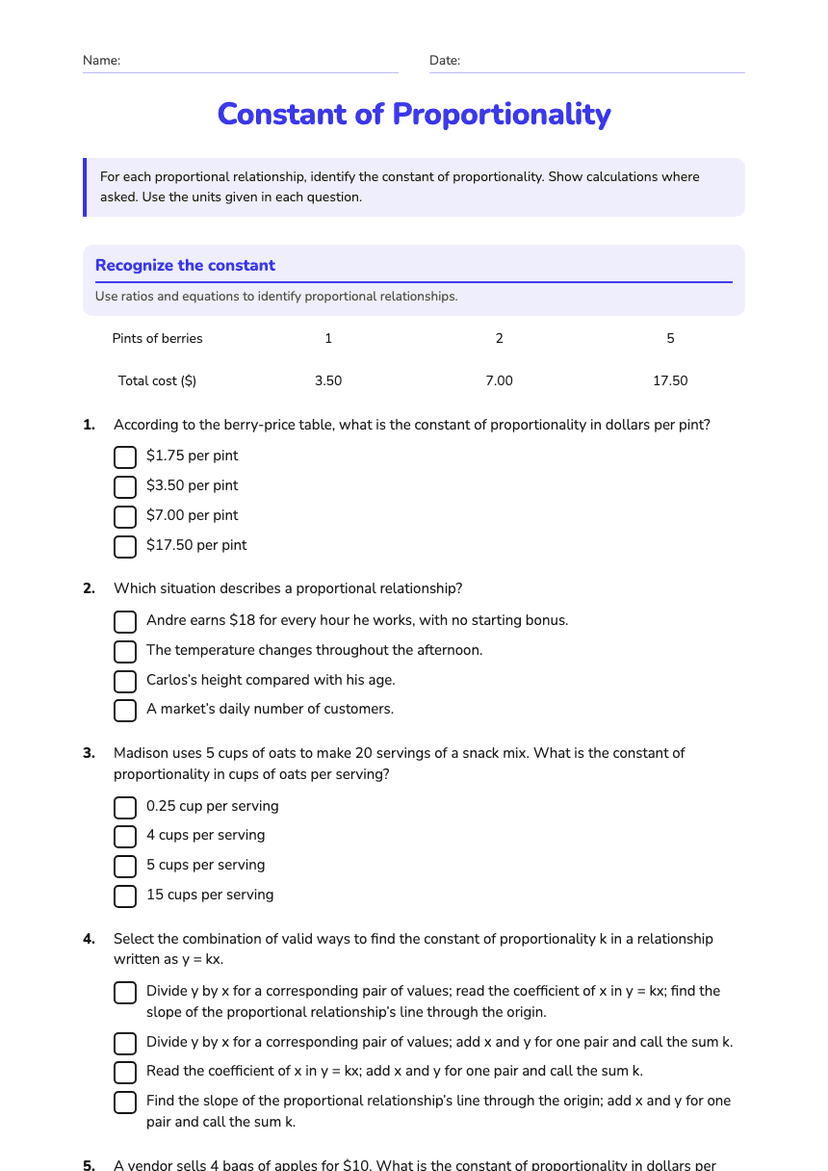
Constant of Proportionality
Free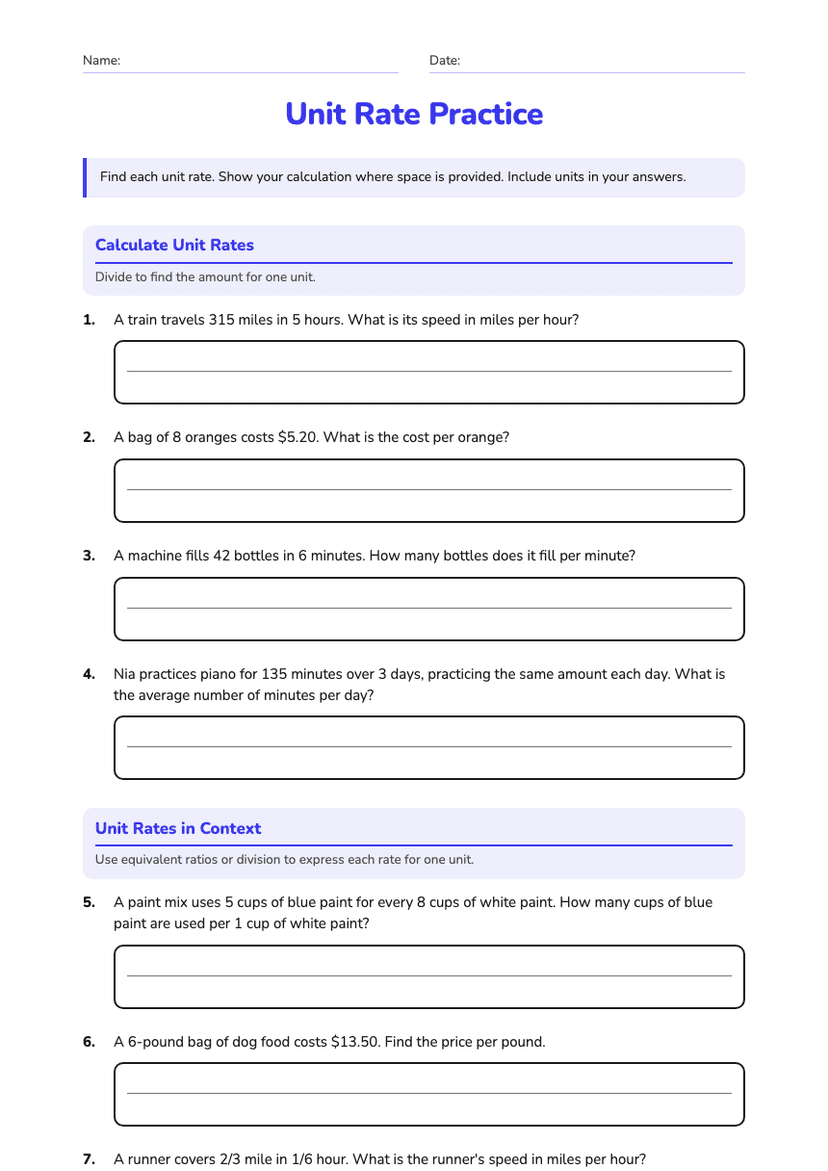
Unit Rate Practice
Free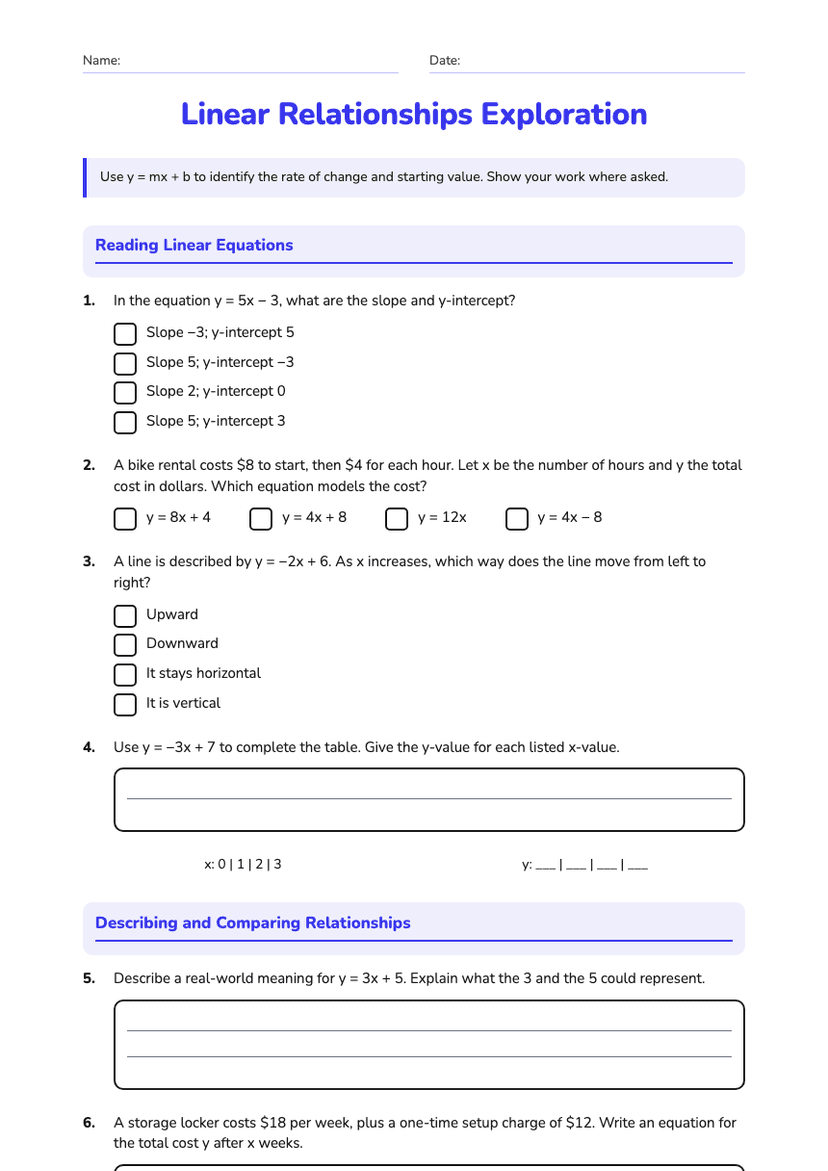
Linear Relationships Exploration
Free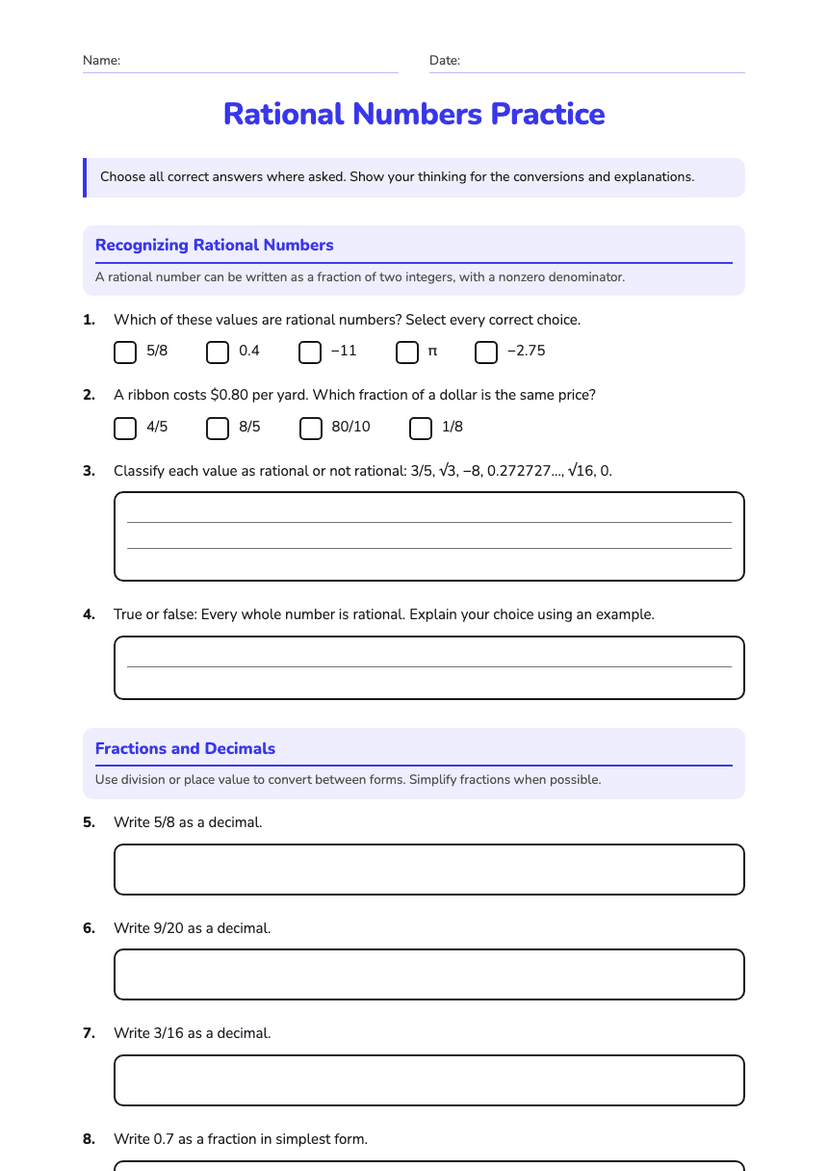
Rational Numbers Practice
Free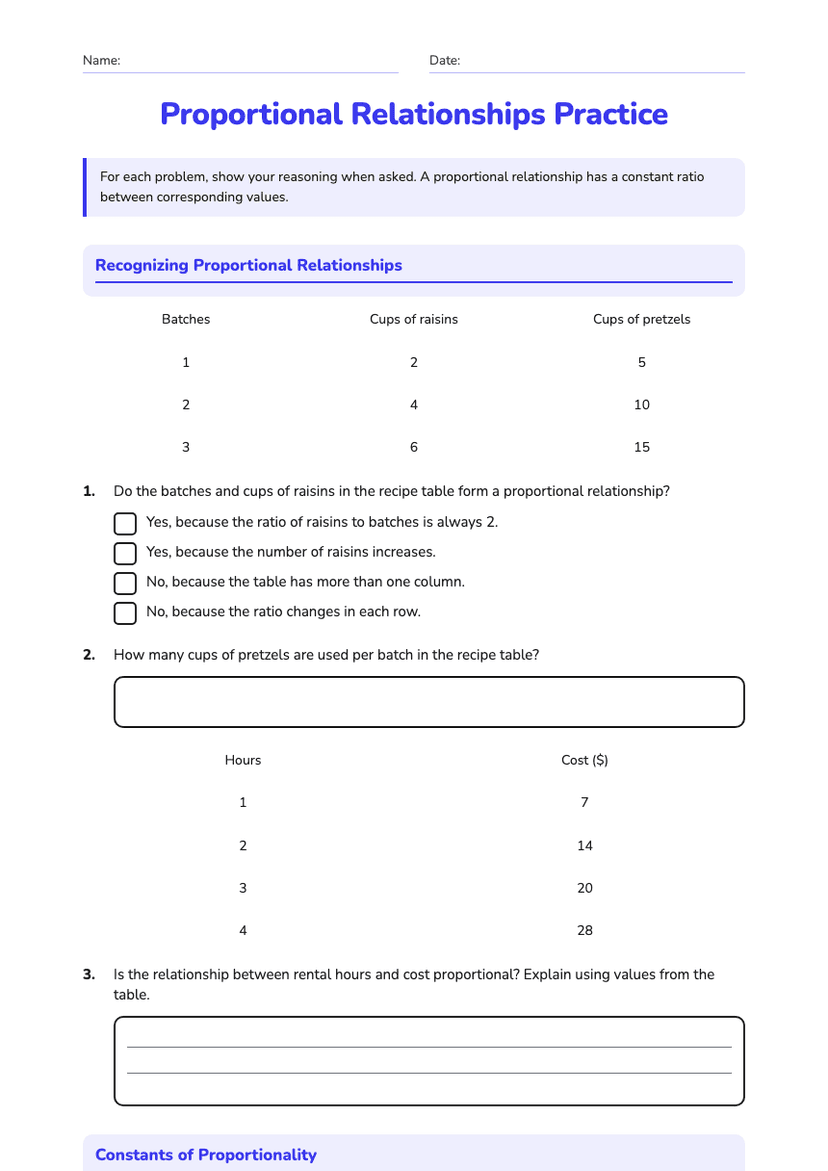
Proportional Relationships Practice
Free