Weather Data Risk Analysis
A free science worksheet ready for your classroom. Open in Kuraplan to grab the print-ready PDF, customize it for your students, or generate a fresh version in seconds.
Weather Data Risk Analysis
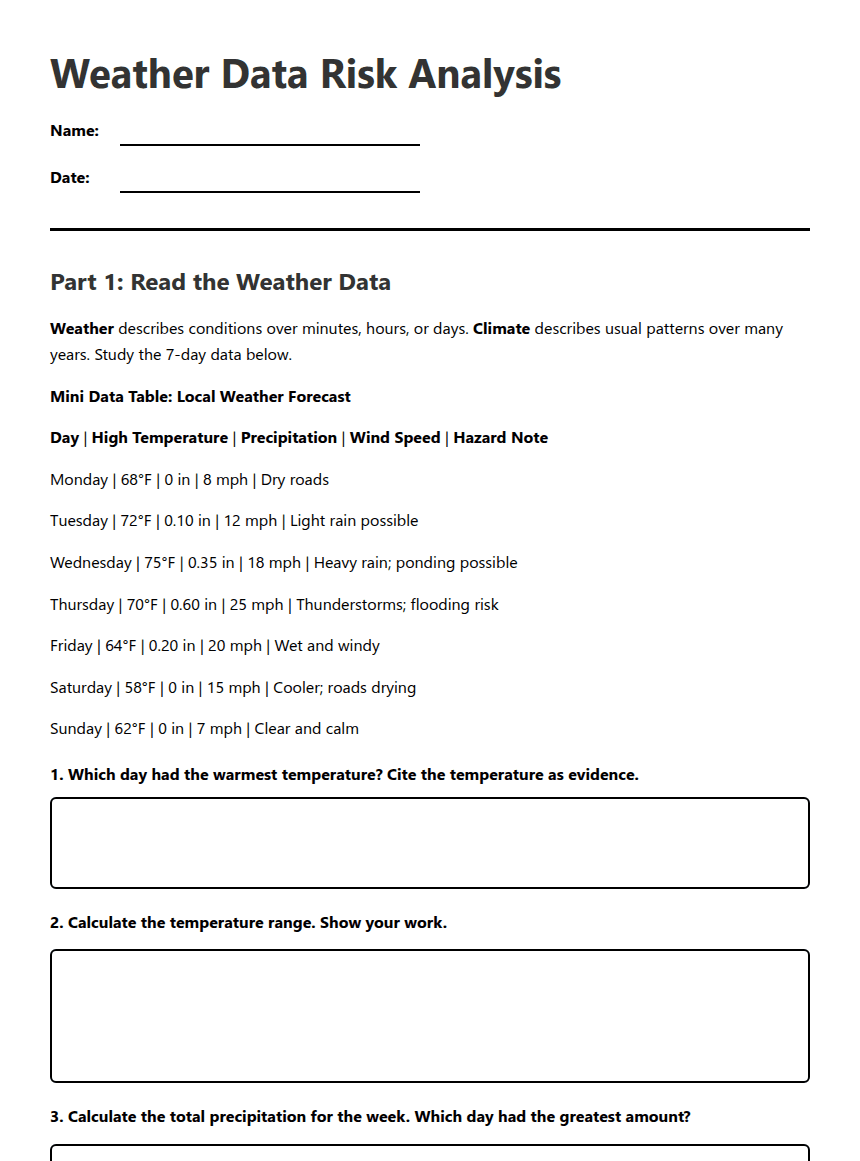
Part 1: Read the Weather Data
Weather describes conditions over minutes, hours, or days. Climate describes usual patterns over many years. Study the 7-day data below.
Mini Data Table: Local Weather Forecast
Day | High Temperature | Precipitation | Wind Speed | Hazard Note
Monday | 68°F | 0 in | 8 mph | Dry roads
Tuesday | 72°F | 0.10 in | 12 mph | Light rain possible
Wednesday | 75°F | 0.35 in | 18 mph | Heavy rain; ponding possible
Thursday | 70°F | 0.60 in | 25 mph | Thunderstorms; flooding risk
Friday | 64°F | 0.20 in | 20 mph | Wet and windy
Saturday | 58°F | 0 in | 15 mph | Cooler; roads drying
Sunday | 62°F | 0 in | 7 mph | Clear and calm
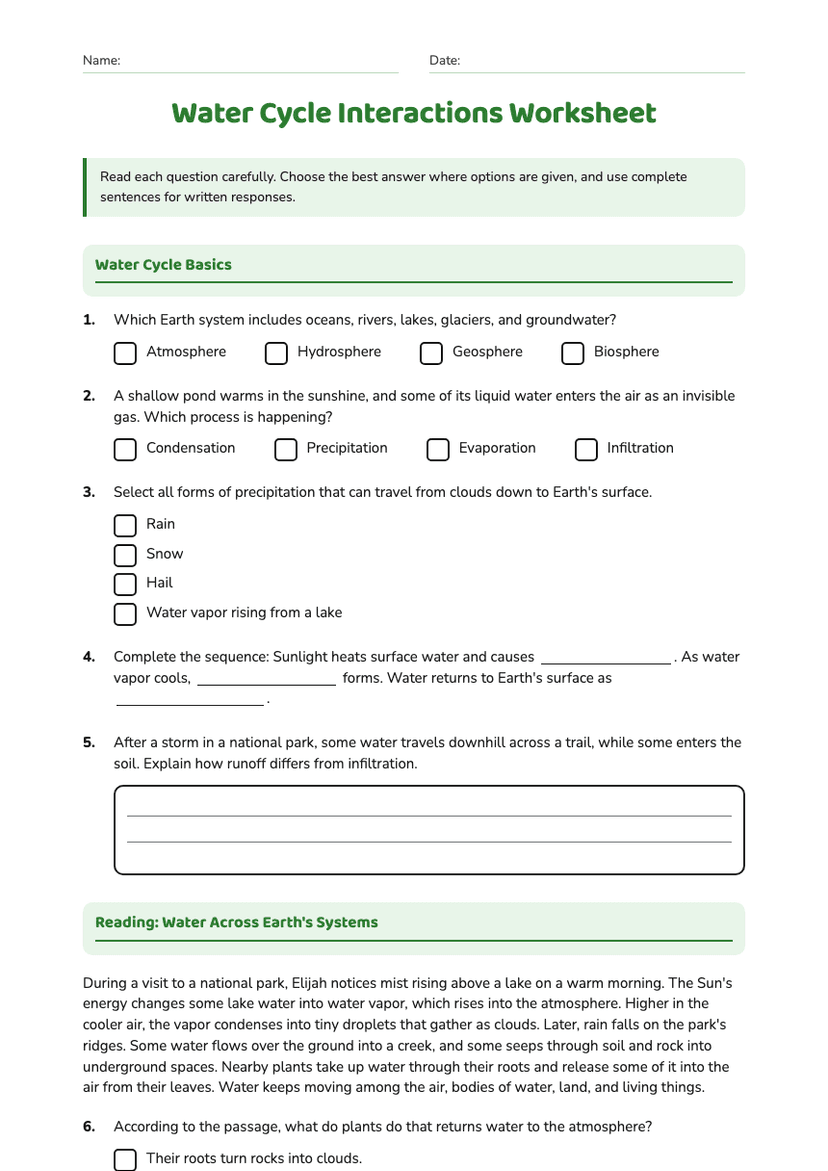
Word choices: evaporation, water vapor, cooling, condensation, clouds, precipitation, air pressure, wind
Part 2: Analyze Risk and Communicate Evidence
Risk = likelihood × impact
Likelihood means how likely an event is. Impact means how much harm or disruption it could cause. Use a scale from 1 (low) to 3 (high).
Hazard Scenario Table
Flood: Two days of heavy rain may fill ditches and streams.
Heat wave: Three days may reach 95°F or higher.
Blizzard: Heavy snow and winds may make roads unsafe.
Severe thunderstorm: Heavy rain, lightning, and 25 mph winds are forecast.
Hazard: ____________________ Likelihood: ____ Impact: ____ Risk score: ____
Sentence frame: The evidence shows __________, so people should __________ because __________.
Claim: The most significant risk is ________________________________________________.
Evidence: One data point is ____________________. Another data point is ____________________.
Reasoning: These data support my claim because __________________________________________.
Support Bank
Vocabulary: forecast—prediction; precipitation—rain, snow, or other water falling from clouds; hazard—something that may cause harm; likelihood—chance that something will happen; impact—effect or harm; evidence—information that supports an idea.
Sentence frames: “The pattern is __________.” “The evidence shows __________.” “The risk is high because __________.” “People should __________ to stay safe.”
Word and picture cues: 🌧 rain | 💨 wind | ⚡ lightning | 🌊 flood | ☀ heat | ❄ snow and ice
Challenge: Compare Monday–Thursday with Saturday–Sunday. Describe one pattern and explain how a changing forecast could change the risk score. If possible, compare these data with a long-term climate record.
Teacher Answer Key
1. Wednesday, 75°F.
2. 75°F − 58°F = 17°F.
3. 0 + 0.10 + 0.35 + 0.60 + 0.20 + 0 + 0 = 1.25 inches. Thursday had the greatest amount, with 0.60 inches.
4. Thursday is the strongest answer. Evidence may include 0.60 inches of precipitation, 25 mph winds, thunderstorms, and a flooding-risk note. Wednesday may receive partial credit if evidence is accurate and reasoning is clear.
5. Sample response: Sunlight warms water. Water evaporates into water vapor. Rising air cools, causing condensation and cloud formation. If droplets grow large enough, precipitation falls.
6–7. Answers may vary. Sample: Severe thunderstorm—likelihood 3, impact 3, risk score 9. Evidence includes the Thursday forecast of thunderstorms, 0.60 inches of rain, and 25 mph winds. A flood could also receive a high score because heavy rain may fill streams and ditches.
8–9. Sample response: The most significant risk is severe thunderstorms and flooding on Thursday. The evidence is 0.60 inches of rain, 25 mph winds, and the hazard note. People should monitor the forecast, avoid flooded roads, and move indoors during lightning because these actions reduce exposure to danger.
Weather and climate reminder: “It is raining this week” describes weather. “This region usually has snowy winters” describes climate.
Standards connection: Students cite evidence from data (RST.6-8.1), interpret a data display (RST.6-8.7), and write a claim supported by reasons and evidence (WHST.6-8.1b).
About This Worksheet
Free in Kuraplan
Sign up free, grab the PDF, and customize it for your class.
Print-Ready
Formatted for standard paper. Clean layout, easy to read.
AI-Generated
Created with Kuraplan's AI, designed for real classroom use.
For Teachers & Parents
Use in classrooms, for homework, tutoring, or homeschool.
Need a custom version of this worksheet?
Kuraplan's AI generates custom worksheets in seconds — differentiated for every learner, aligned to your curriculum.
Generate Custom Worksheets — Free