MathsFreePrintable
Creating Data Infographics
A free maths worksheet ready for your classroom. Open in Kuraplan to grab the print-ready PDF, customize it for your students, or generate a fresh version in seconds.

Name:Date:
Creating Data Infographics
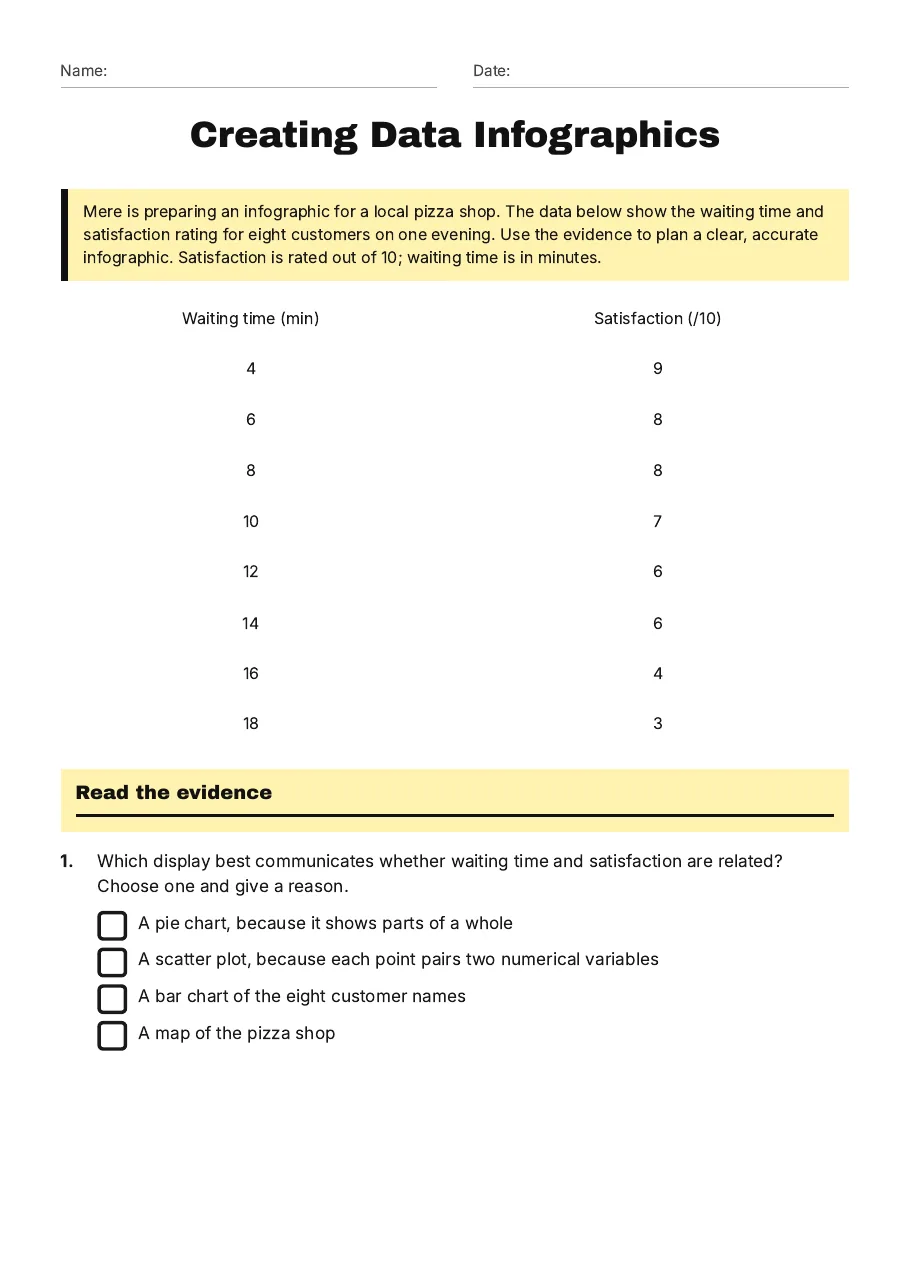
Mere is preparing an infographic for a local pizza shop. The data below show the waiting time and satisfaction rating for eight customers on one evening. Use the evidence to plan a clear, accurate infographic. Satisfaction is rated out of 10; waiting time is in minutes.
Waiting time (min)
Satisfaction (/10)
4
9
6
8
8
8
10
7
12
6
14
6
16
4
18
3
Read the evidence
1.Which display best communicates whether waiting time and satisfaction are related? Choose one and give a reason.
- A pie chart, because it shows parts of a whole
- A scatter plot, because each point pairs two numerical variables
- A bar chart of the eight customer names
- A map of the pizza shop
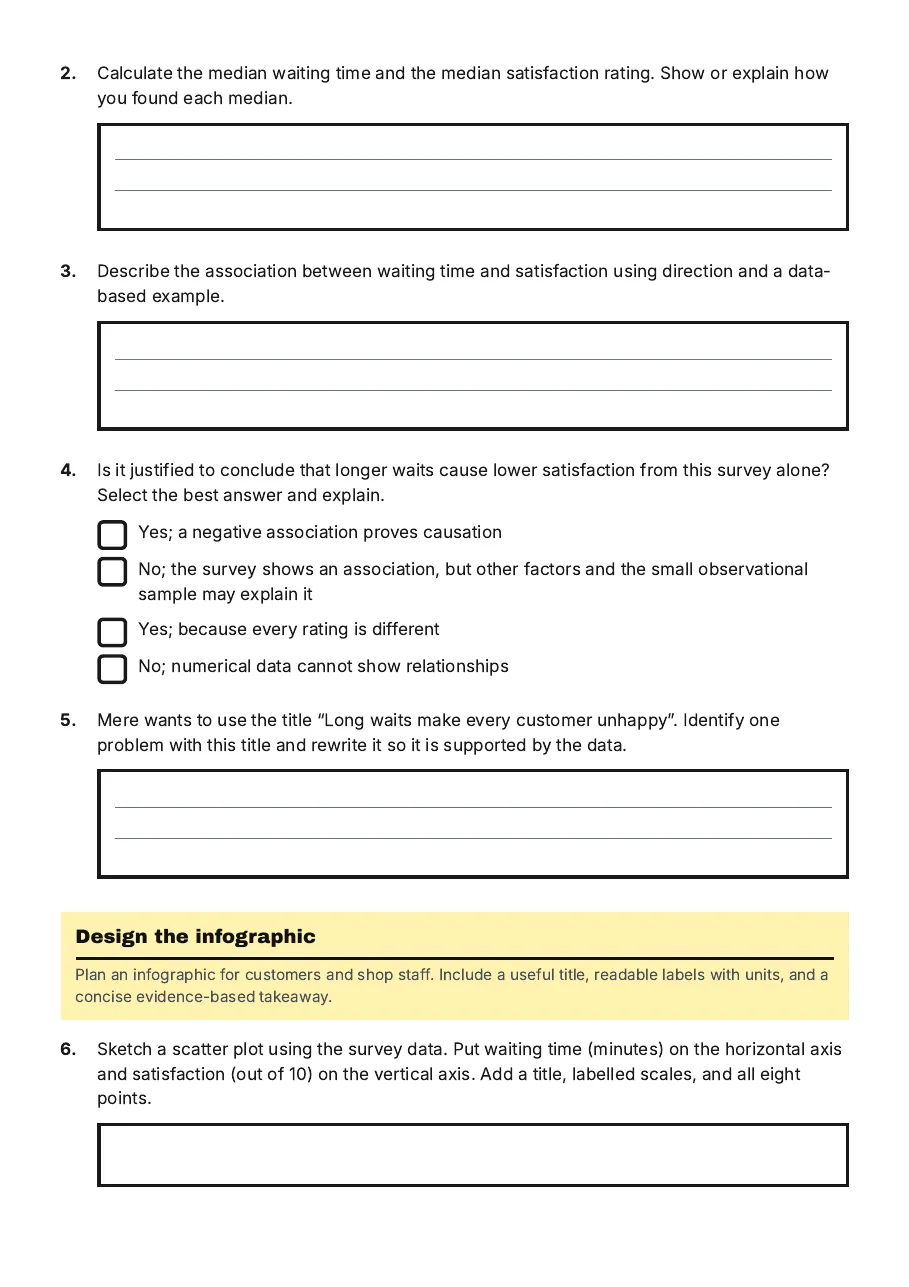
2.Calculate the median waiting time and the median satisfaction rating. Show or explain how you found each median.
3.Describe the association between waiting time and satisfaction using direction and a data-based example.
4.Is it justified to conclude that longer waits cause lower satisfaction from this survey alone? Select the best answer and explain.
- Yes; a negative association proves causation
- No; the survey shows an association, but other factors and the small observational sample may explain it
- Yes; because every rating is different
- No; numerical data cannot show relationships
5.Mere wants to use the title “Long waits make every customer unhappy”. Identify one problem with this title and rewrite it so it is supported by the data.
Design the infographic
Plan an infographic for customers and shop staff. Include a useful title, readable labels with units, and a concise evidence-based takeaway.
6.Sketch a scatter plot using the survey data. Put waiting time (minutes) on the horizontal axis and satisfaction (out of 10) on the vertical axis. Add a title, labelled scales, and all eight points.
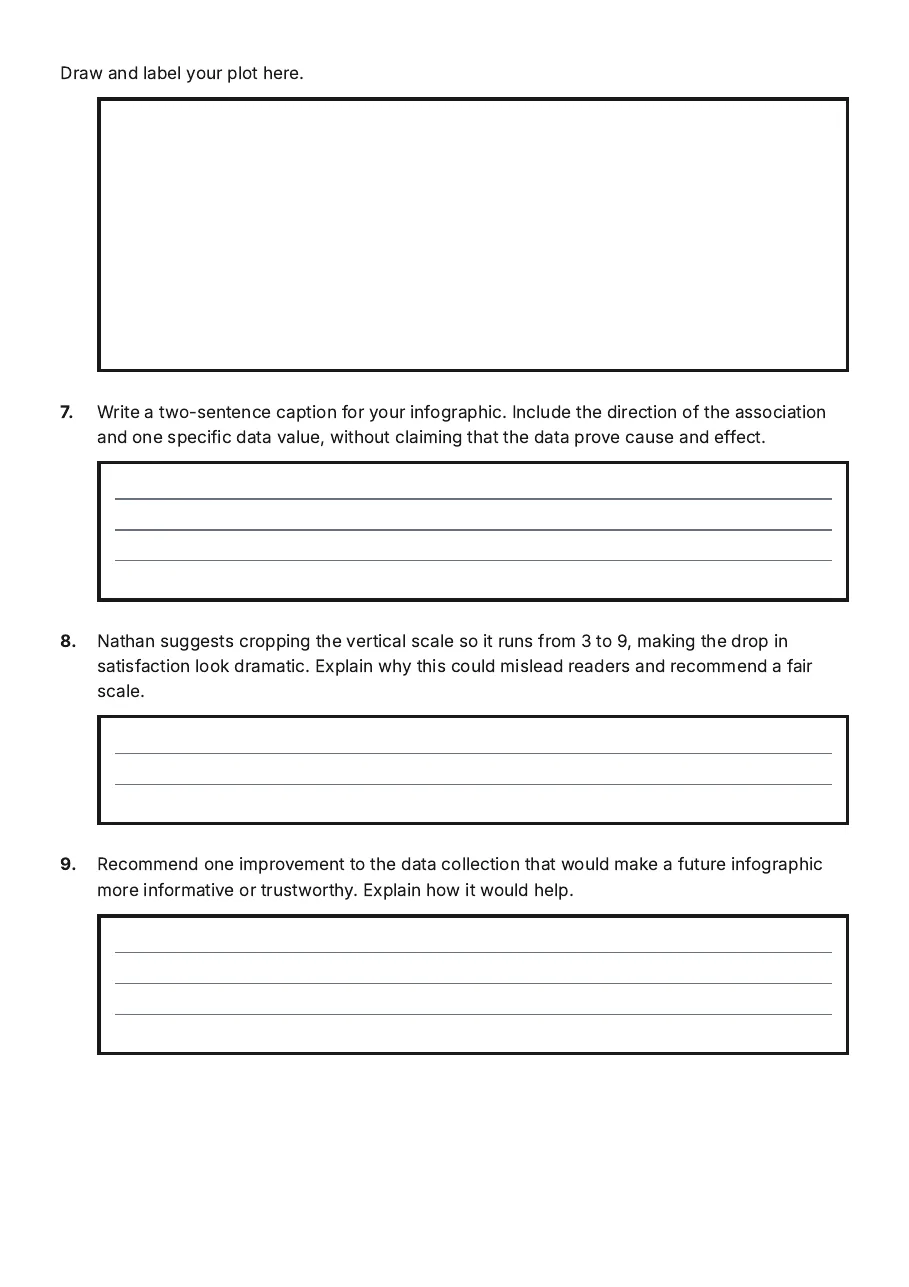
Draw and label your plot here.
7.Write a two-sentence caption for your infographic. Include the direction of the association and one specific data value, without claiming that the data prove cause and effect.
8.Nathan suggests cropping the vertical scale so it runs from 3 to 9, making the drop in satisfaction look dramatic. Explain why this could mislead readers and recommend a fair scale.
9.Recommend one improvement to the data collection that would make a future infographic more informative or trustworthy. Explain how it would help.
3 printable pages
Page 1
Page 2
Page 3
About This Worksheet
Free in Kuraplan
Sign up free, grab the PDF, and customize it for your class.
Print-Ready
Formatted for standard paper. Clean layout, easy to read.
AI-Generated
Created with Kuraplan's AI, designed for real classroom use.
For Teachers & Parents
Use in classrooms, for homework, tutoring, or homeschool.
Need a custom version of this worksheet?
Kuraplan's AI generates custom worksheets in seconds — differentiated for every learner, aligned to your curriculum.
Generate Custom Worksheets — Free No credit card Curriculum-aligned Under 60 seconds