Creating Simple Bar Graphs
A free maths worksheet ready for your classroom. Open in Kuraplan to grab the print-ready PDF, customize it for your students, or generate a fresh version in seconds.
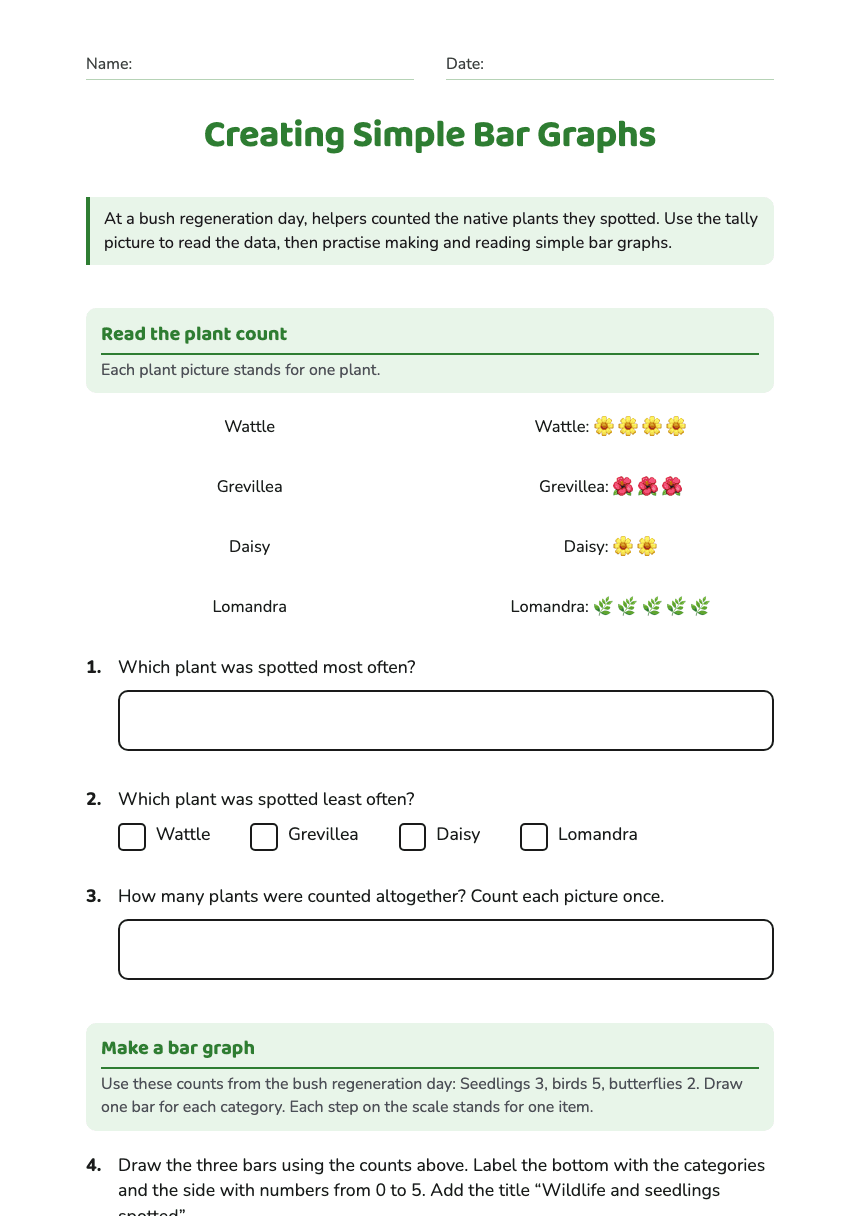
Creating Simple Bar Graphs
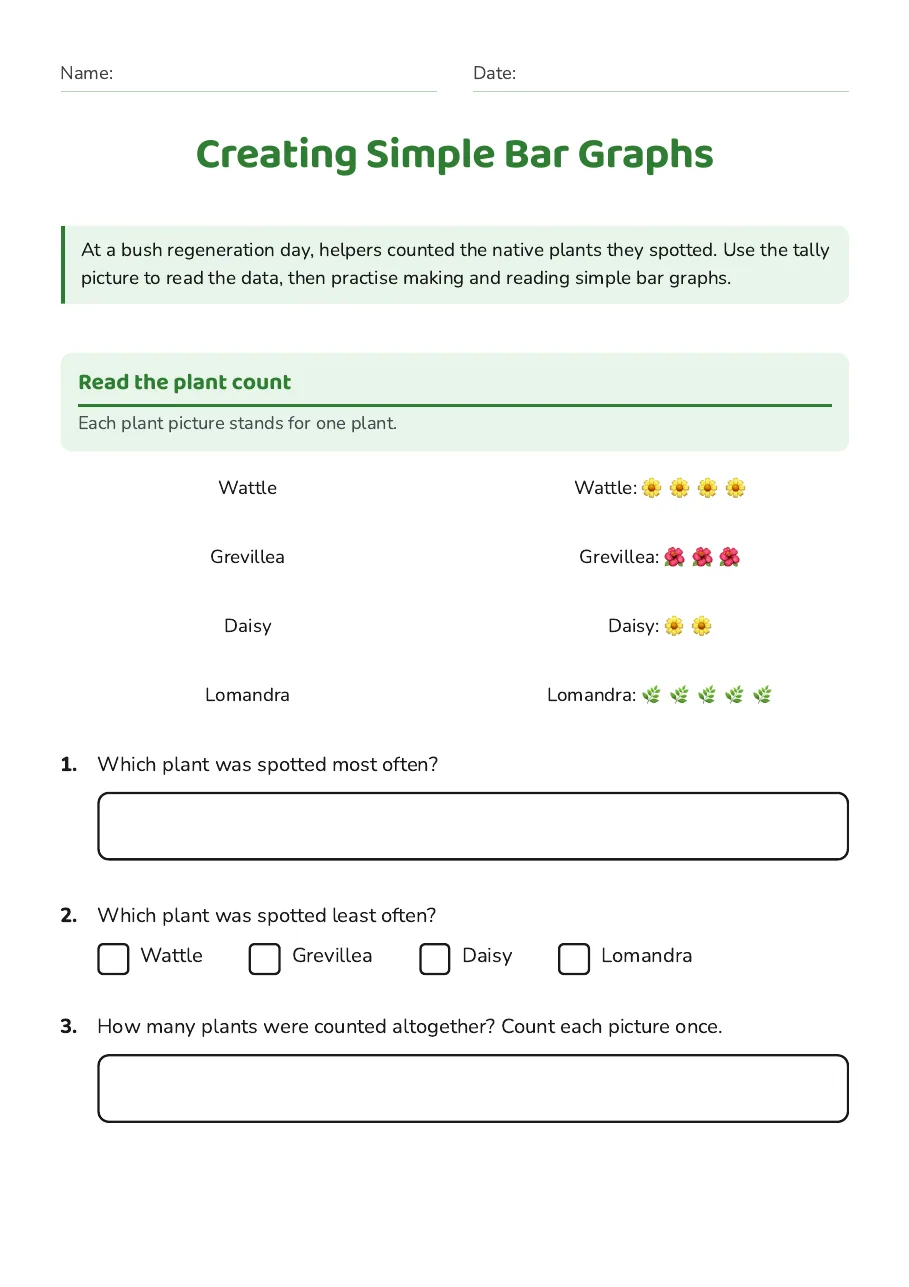
Read the plant count
Each plant picture stands for one plant.
Wattle
Wattle: 🌼 🌼 🌼 🌼
Grevillea
Grevillea: 🌺 🌺 🌺
Daisy
Daisy: 🌼 🌼
Lomandra
Lomandra: 🌿 🌿 🌿 🌿 🌿
- Wattle
- Grevillea
- Daisy
- Lomandra
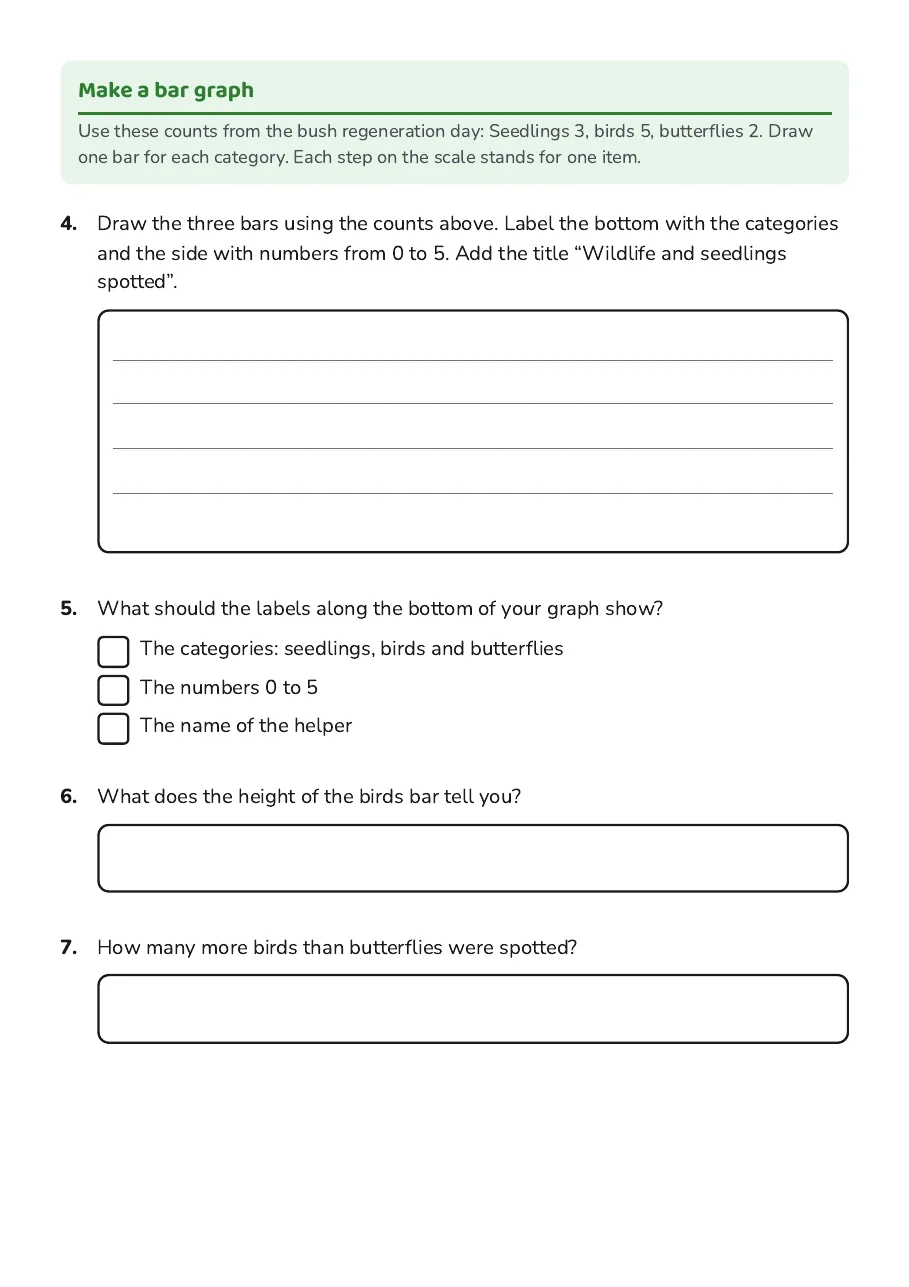
Make a bar graph
Use these counts from the bush regeneration day: Seedlings 3, birds 5, butterflies 2. Draw one bar for each category. Each step on the scale stands for one item.
- The categories: seedlings, birds and butterflies
- The numbers 0 to 5
- The name of the helper
3 printable pages
Page 1
Page 2
Page 3
About This Worksheet
Free in Kuraplan
Sign up free, grab the PDF, and customize it for your class.
Print-Ready
Formatted for standard paper. Clean layout, easy to read.
AI-Generated
Created with Kuraplan's AI, designed for real classroom use.
For Teachers & Parents
Use in classrooms, for homework, tutoring, or homeschool.
Need a custom version of this worksheet?
Kuraplan's AI generates custom worksheets in seconds — differentiated for every learner, aligned to your curriculum.
Generate Custom Worksheets — Free