Data Detective Conclusions
A free maths worksheet ready for your classroom. Open in Kuraplan to grab the print-ready PDF, customize it for your students, or generate a fresh version in seconds.
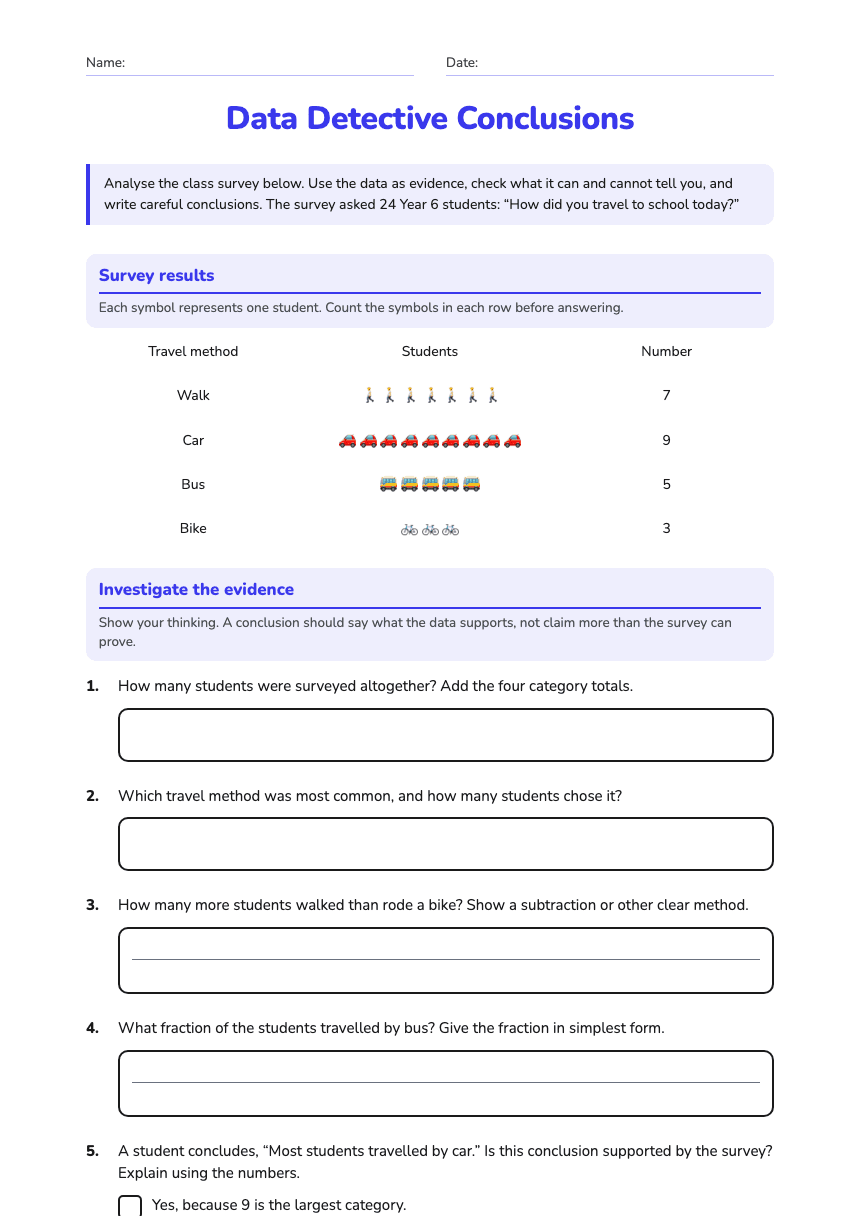
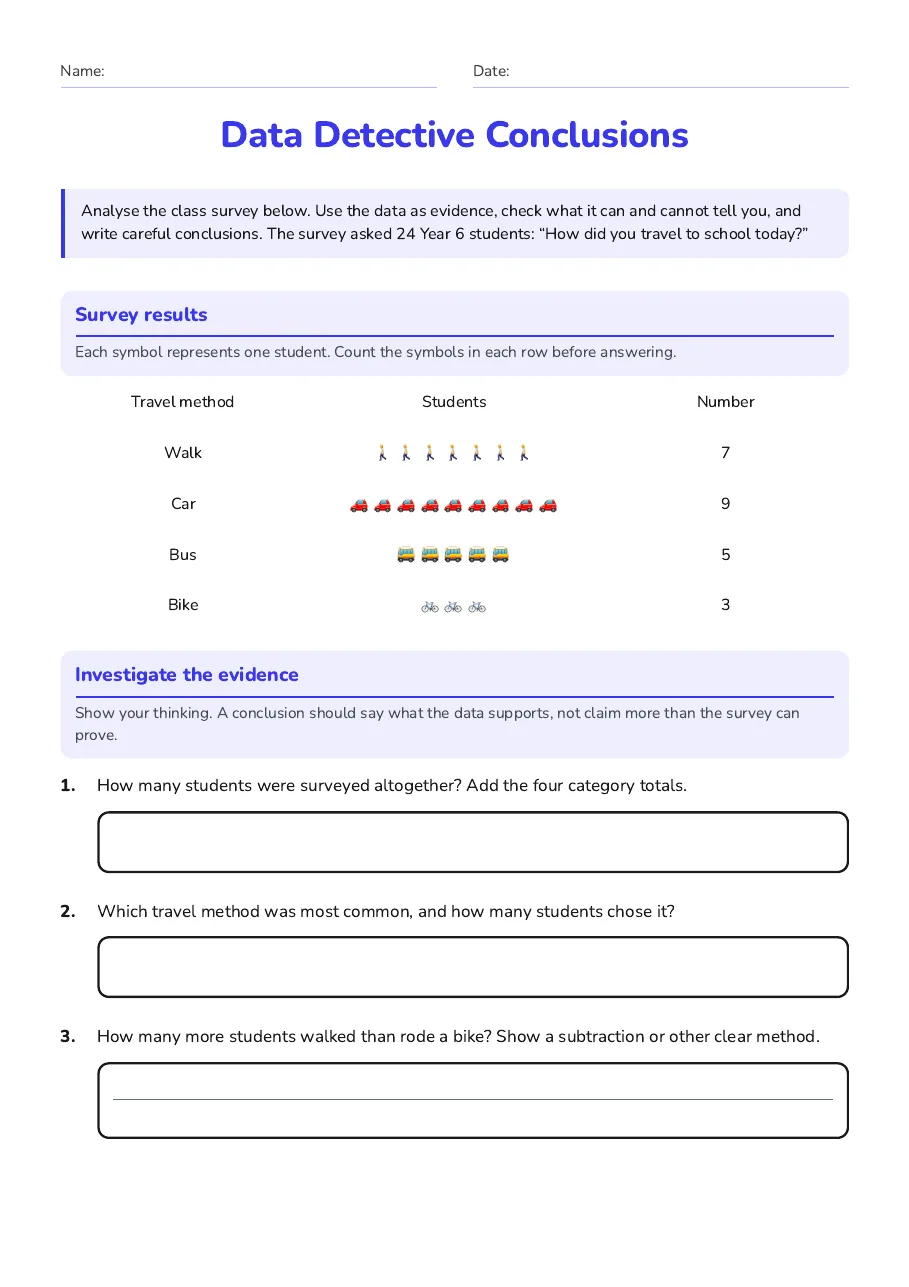
Data Detective Conclusions
Survey results
Each symbol represents one student. Count the symbols in each row before answering.
Travel method
Students
Number
Walk
🚶 🚶 🚶 🚶 🚶 🚶 🚶
7
Car
🚗 🚗 🚗 🚗 🚗 🚗 🚗 🚗 🚗
9
Bus
🚌 🚌 🚌 🚌 🚌
5
Bike
🚲 🚲 🚲
3
Investigate the evidence
Show your thinking. A conclusion should say what the data supports, not claim more than the survey can prove.
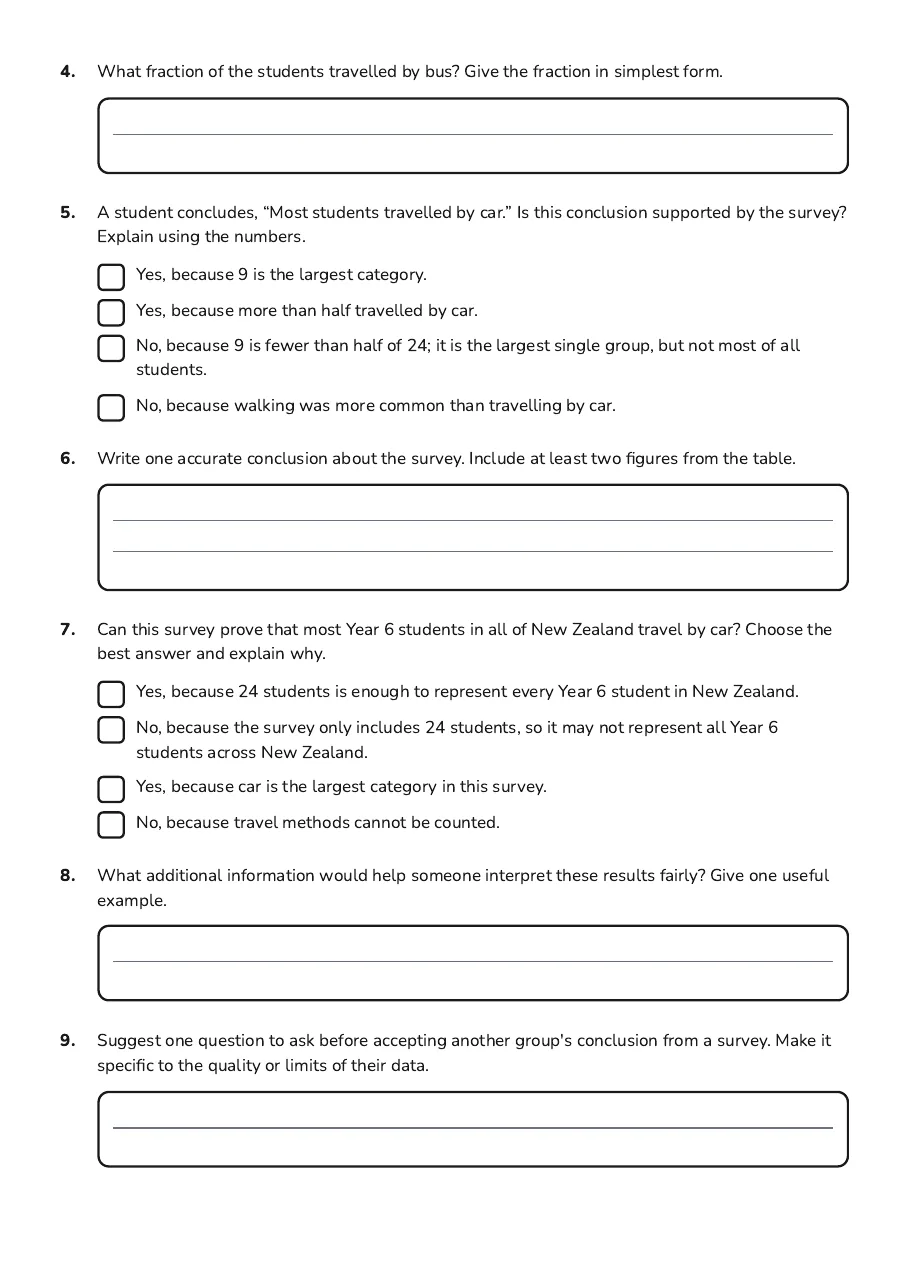
- Yes, because 9 is the largest category.
- Yes, because more than half travelled by car.
- No, because 9 is fewer than half of 24; it is the largest single group, but not most of all students.
- No, because walking was more common than travelling by car.
- Yes, because 24 students is enough to represent every Year 6 student in New Zealand.
- No, because the survey only includes 24 students, so it may not represent all Year 6 students across New Zealand.
- Yes, because car is the largest category in this survey.
- No, because travel methods cannot be counted.
2 printable pages
Page 1
Page 2
About This Worksheet
Free in Kuraplan
Sign up free, grab the PDF, and customize it for your class.
Print-Ready
Formatted for standard paper. Clean layout, easy to read.
AI-Generated
Created with Kuraplan's AI, designed for real classroom use.
For Teachers & Parents
Use in classrooms, for homework, tutoring, or homeschool.
Need a custom version of this worksheet?
Kuraplan's AI generates custom worksheets in seconds — differentiated for every learner, aligned to your curriculum.
Generate Custom Worksheets — Free