MathsFreePrintable

Data Detective Worksheet

A free maths worksheet ready for your classroom. Open in Kuraplan to grab the print-ready PDF, customize it for your students, or generate a fresh version in seconds.
Data Detective Worksheet worksheet preview
Name:Date:

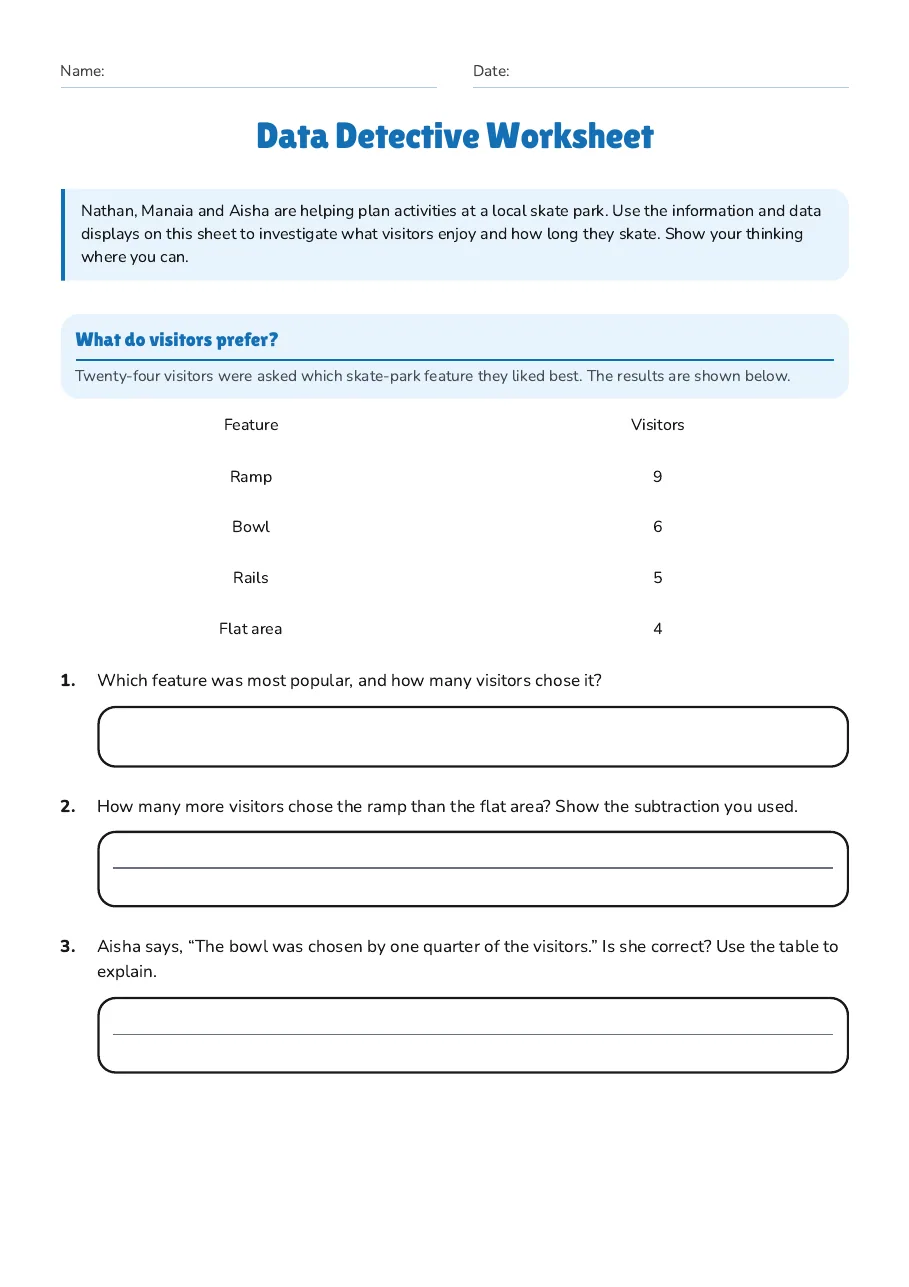
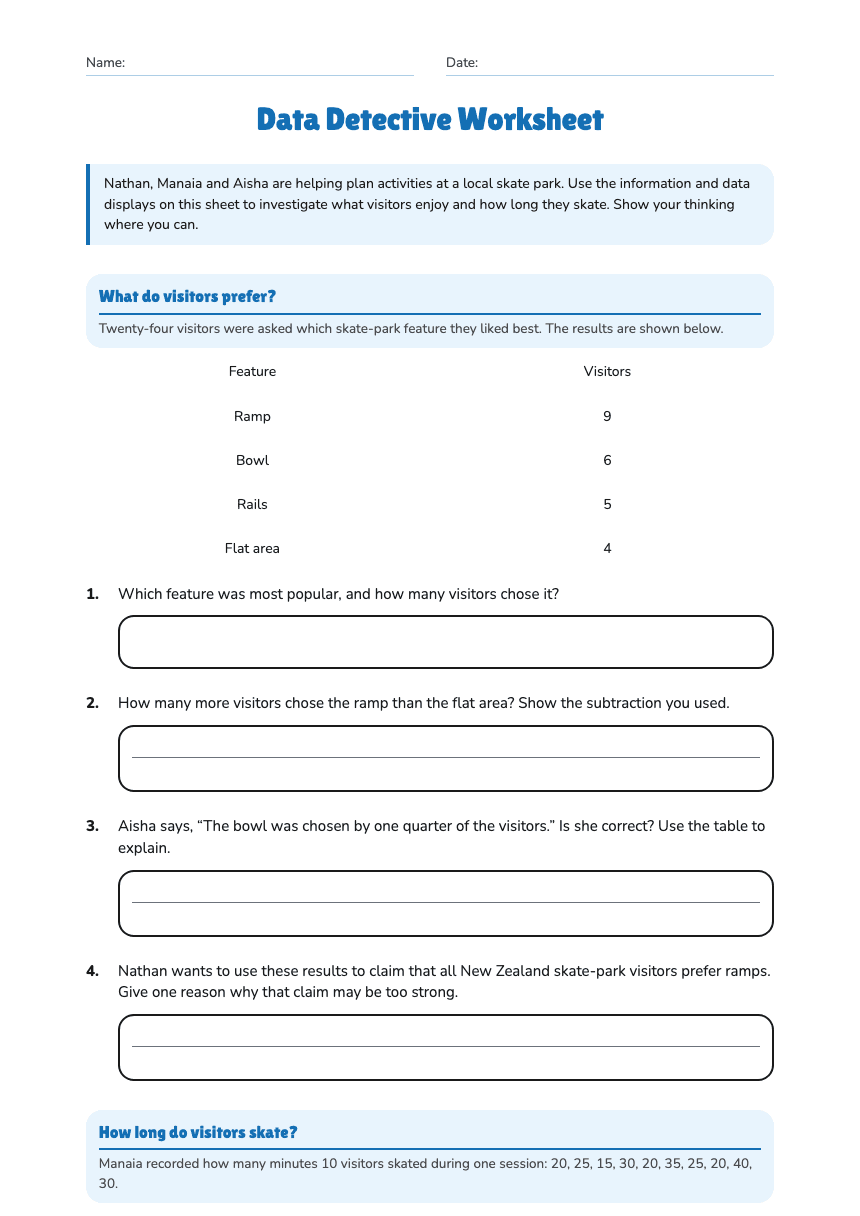
Data Detective Worksheet

Nathan, Manaia and Aisha are helping plan activities at a local skate park. Use the information and data displays on this sheet to investigate what visitors enjoy and how long they skate. Show your thinking where you can.

What do visitors prefer?

Twenty-four visitors were asked which skate-park feature they liked best. The results are shown below.

Feature

Visitors

Ramp

9

Bowl

6

Rails

5

Flat area

4

1.Which feature was most popular, and how many visitors chose it?
2.How many more visitors chose the ramp than the flat area? Show the subtraction you used.
3.Aisha says, “The bowl was chosen by one quarter of the visitors.” Is she correct? Use the table to explain.
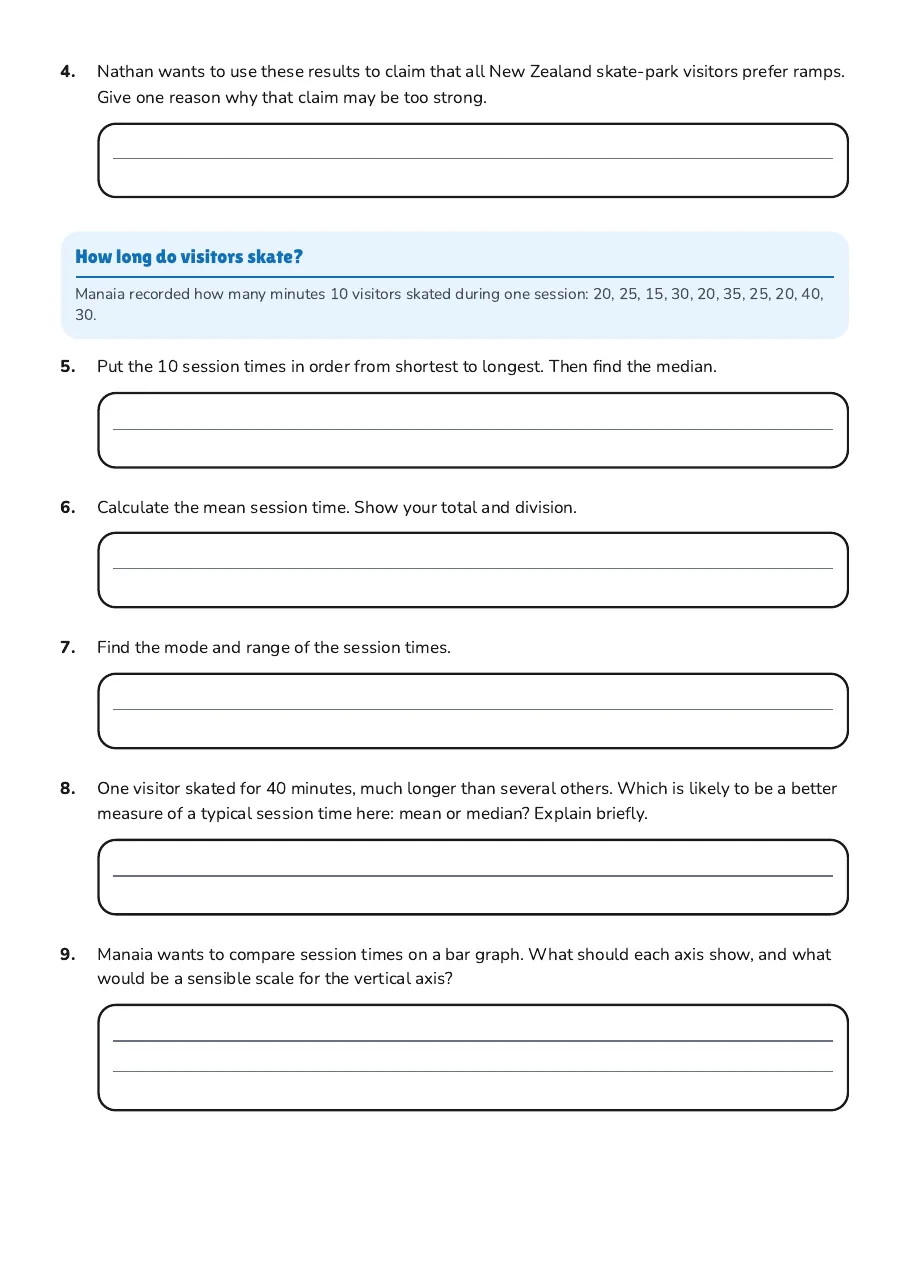
4.Nathan wants to use these results to claim that all New Zealand skate-park visitors prefer ramps. Give one reason why that claim may be too strong.

How long do visitors skate?

Manaia recorded how many minutes 10 visitors skated during one session: 20, 25, 15, 30, 20, 35, 25, 20, 40, 30.

5.Put the 10 session times in order from shortest to longest. Then find the median.
6.Calculate the mean session time. Show your total and division.
7.Find the mode and range of the session times.
8.One visitor skated for 40 minutes, much longer than several others. Which is likely to be a better measure of a typical session time here: mean or median? Explain briefly.
9.Manaia wants to compare session times on a bar graph. What should each axis show, and what would be a sensible scale for the vertical axis?
10.A social media post says, “Visitors skate for 26 minutes on average, so everyone skates for about half an hour.” Is this conclusion supported by the data? Explain using one statistic or detail.

3 printable pages

  • Data Detective Worksheet, page 1 of 3: What do visitors prefer?

    Page 1

  • Data Detective Worksheet, page 2 of 3: How long do visitors skate?

    Page 2

  • Data Detective Worksheet, page 3 of 3: 10. A social media post says, “Visitors skate for 26 minutes on average, so everyone…

    Page 3

About This Worksheet

Free in Kuraplan

Sign up free, grab the PDF, and customize it for your class.

Print-Ready

Formatted for standard paper. Clean layout, easy to read.

AI-Generated

Created with Kuraplan's AI, designed for real classroom use.

For Teachers & Parents

Use in classrooms, for homework, tutoring, or homeschool.

Need a custom version of this worksheet?

Kuraplan's AI generates custom worksheets in seconds — differentiated for every learner, aligned to your curriculum.

Generate Custom Worksheets — Free
No credit card Curriculum-aligned Under 60 seconds