Data Display Methods
A free maths worksheet ready for your classroom. Open in Kuraplan to grab the print-ready PDF, customize it for your students, or generate a fresh version in seconds.

Data Display Methods
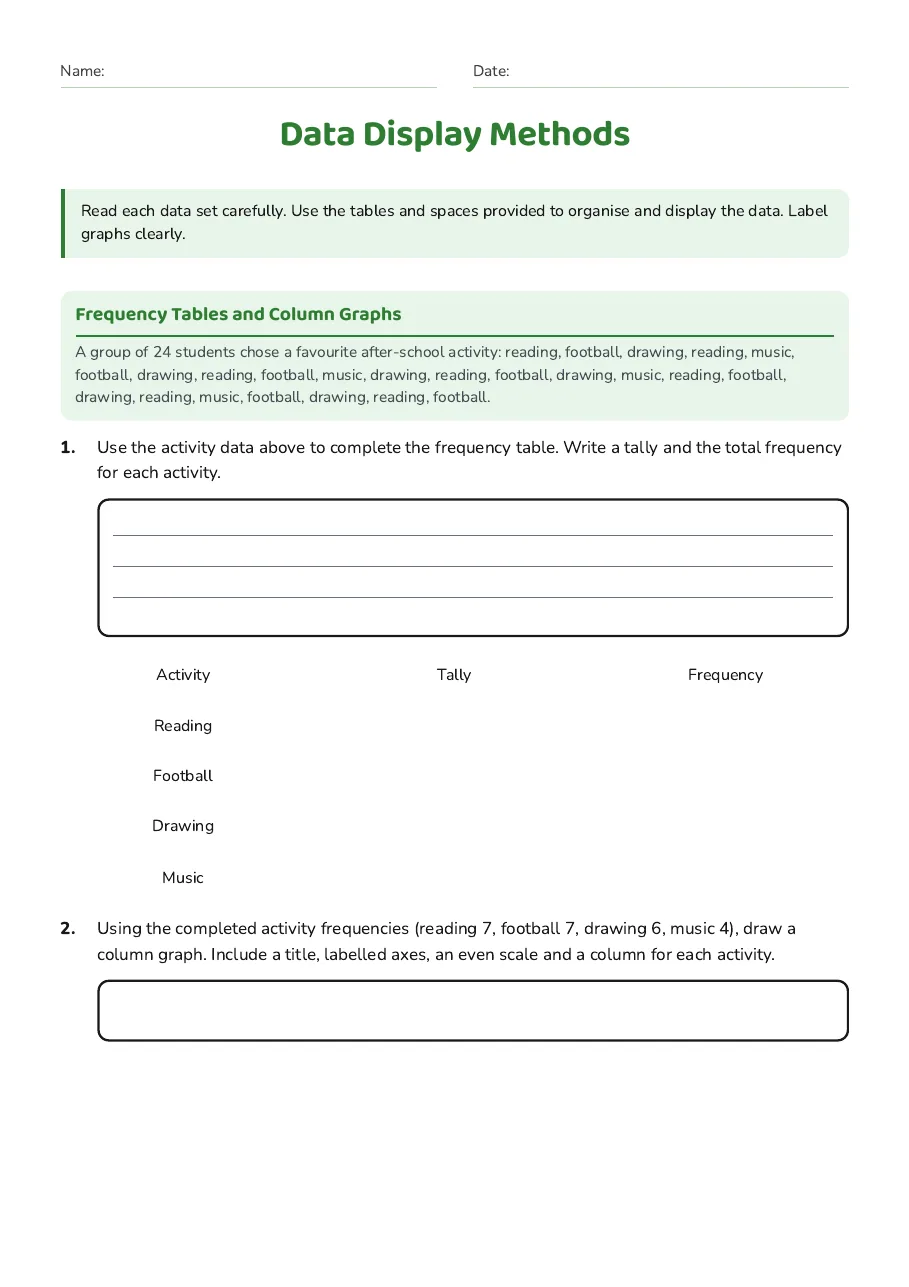
Frequency Tables and Column Graphs
A group of 24 students chose a favourite after-school activity: reading, football, drawing, reading, music, football, drawing, reading, football, music, drawing, reading, football, drawing, music, reading, football, drawing, reading, music, football, drawing, reading, football.
Activity
Tally
Frequency
Reading
Football
Drawing
Music
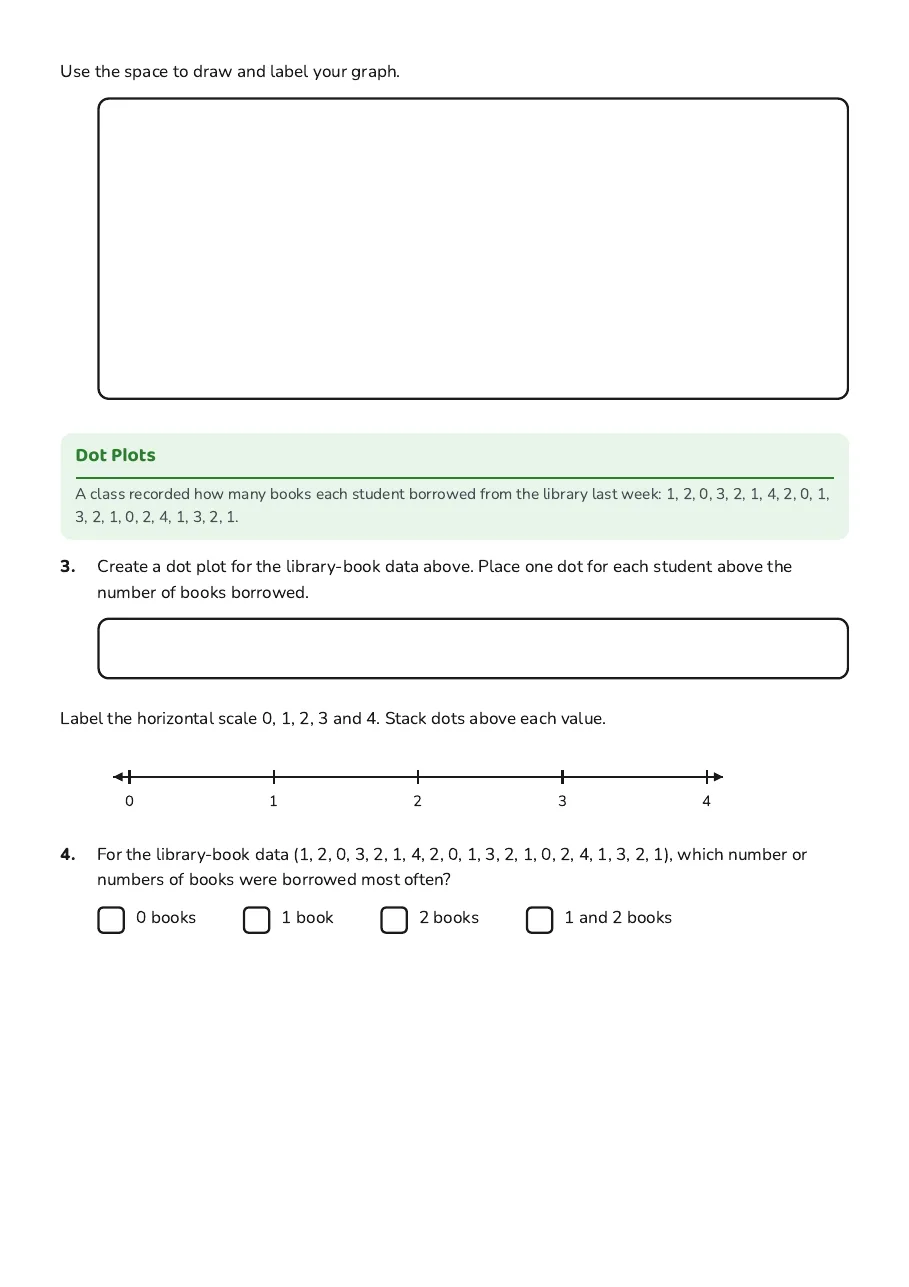
Dot Plots
A class recorded how many books each student borrowed from the library last week: 1, 2, 0, 3, 2, 1, 4, 2, 0, 1, 3, 2, 1, 0, 2, 4, 1, 3, 2, 1.
- 0 books
- 1 book
- 2 books
- 1 and 2 books
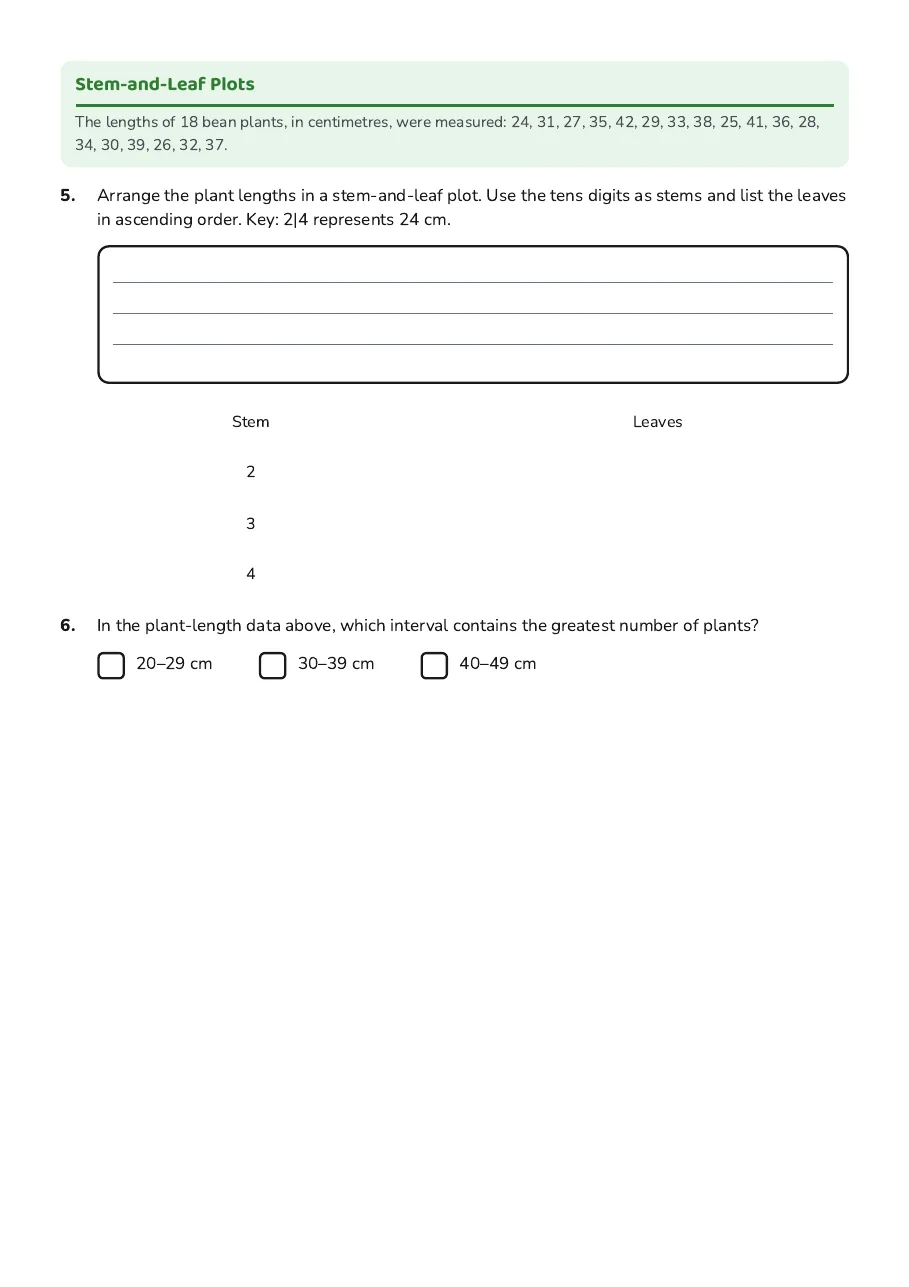
Stem-and-Leaf Plots
The lengths of 18 bean plants, in centimetres, were measured: 24, 31, 27, 35, 42, 29, 33, 38, 25, 41, 36, 28, 34, 30, 39, 26, 32, 37.
Stem
Leaves
2
3
4
- 20–29 cm
- 30–39 cm
- 40–49 cm
3 printable pages
Page 1
Page 2
Page 3
About This Worksheet
Free in Kuraplan
Sign up free, grab the PDF, and customize it for your class.
Print-Ready
Formatted for standard paper. Clean layout, easy to read.
AI-Generated
Created with Kuraplan's AI, designed for real classroom use.
For Teachers & Parents
Use in classrooms, for homework, tutoring, or homeschool.
Need a custom version of this worksheet?
Kuraplan's AI generates custom worksheets in seconds — differentiated for every learner, aligned to your curriculum.
Generate Custom Worksheets — Free