MathsFreePrintable

Endangered Species Data Investigation

A free maths worksheet ready for your classroom. Open in Kuraplan to grab the print-ready PDF, customize it for your students, or generate a fresh version in seconds.
Endangered Species Data Investigation worksheet preview
Name:Date:

Endangered Species Data Investigation

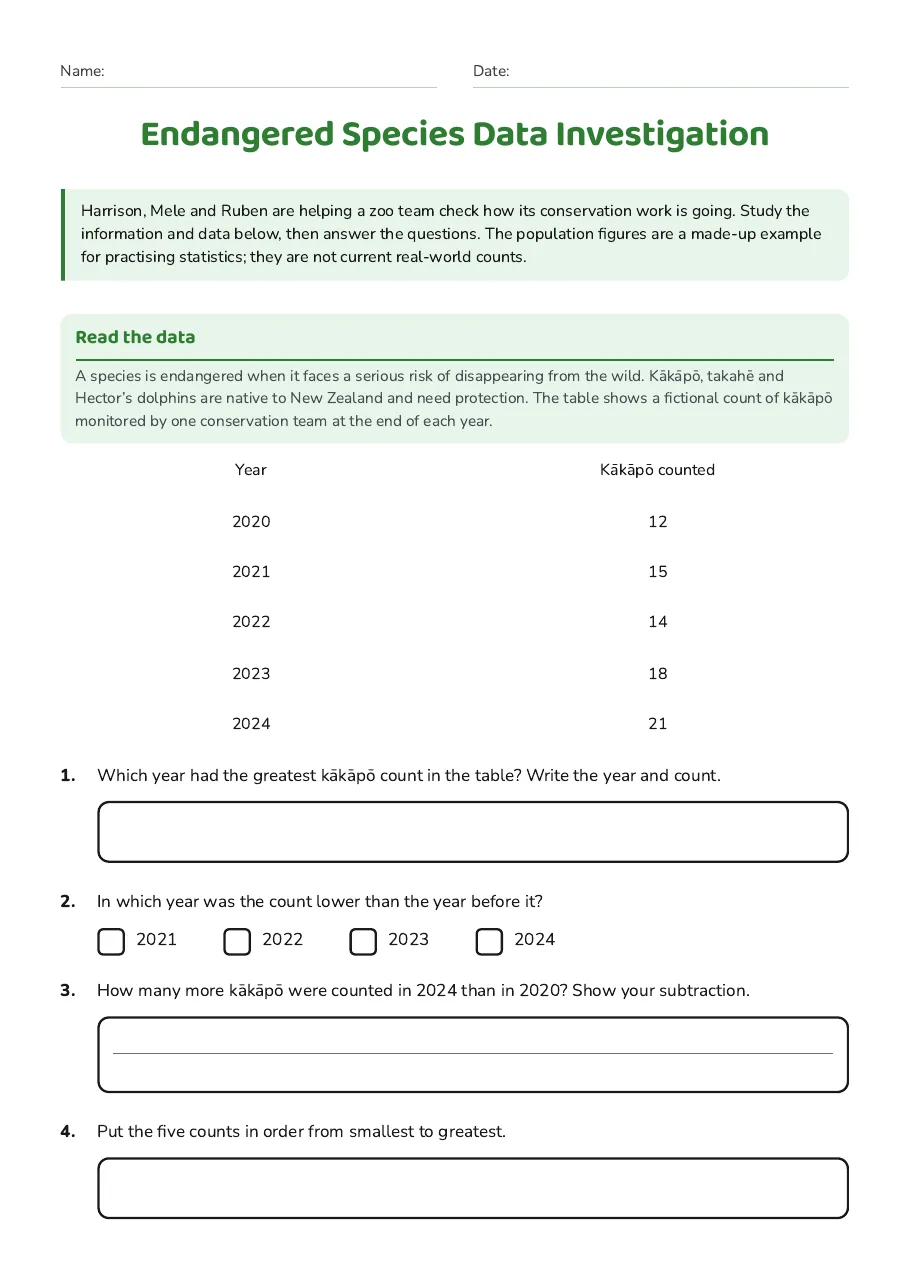
Harrison, Mele and Ruben are helping a zoo team check how its conservation work is going. Study the information and data below, then answer the questions. The population figures are a made-up example for practising statistics; they are not current real-world counts.

Read the data

A species is endangered when it faces a serious risk of disappearing from the wild. Kākāpō, takahē and Hector’s dolphins are native to New Zealand and need protection. The table shows a fictional count of kākāpō monitored by one conservation team at the end of each year.

Year

Kākāpō counted

2020

12

2021

15

2022

14

2023

18

2024

21

1.Which year had the greatest kākāpō count in the table? Write the year and count.
2.In which year was the count lower than the year before it?
  • 2021
  • 2022
  • 2023
  • 2024
3.How many more kākāpō were counted in 2024 than in 2020? Show your subtraction.
4.Put the five counts in order from smallest to greatest.
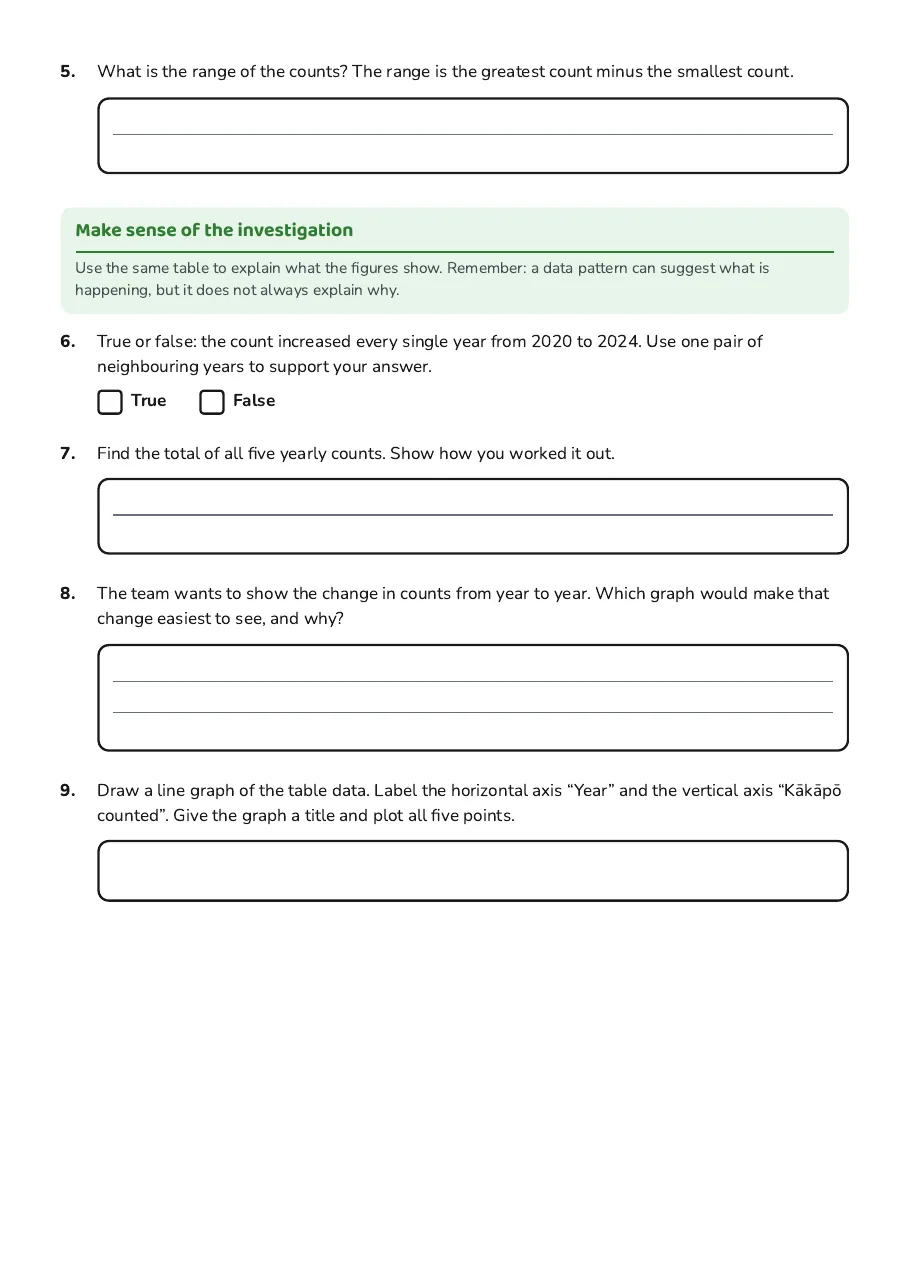
5.What is the range of the counts? The range is the greatest count minus the smallest count.

Make sense of the investigation

Use the same table to explain what the figures show. Remember: a data pattern can suggest what is happening, but it does not always explain why.

6.True or false: the count increased every single year from 2020 to 2024. Use one pair of neighbouring years to support your answer.
TrueFalse
7.Find the total of all five yearly counts. Show how you worked it out.
8.The team wants to show the change in counts from year to year. Which graph would make that change easiest to see, and why?
9.Draw a line graph of the table data. Label the horizontal axis “Year” and the vertical axis “Kākāpō counted”. Give the graph a title and plot all five points.
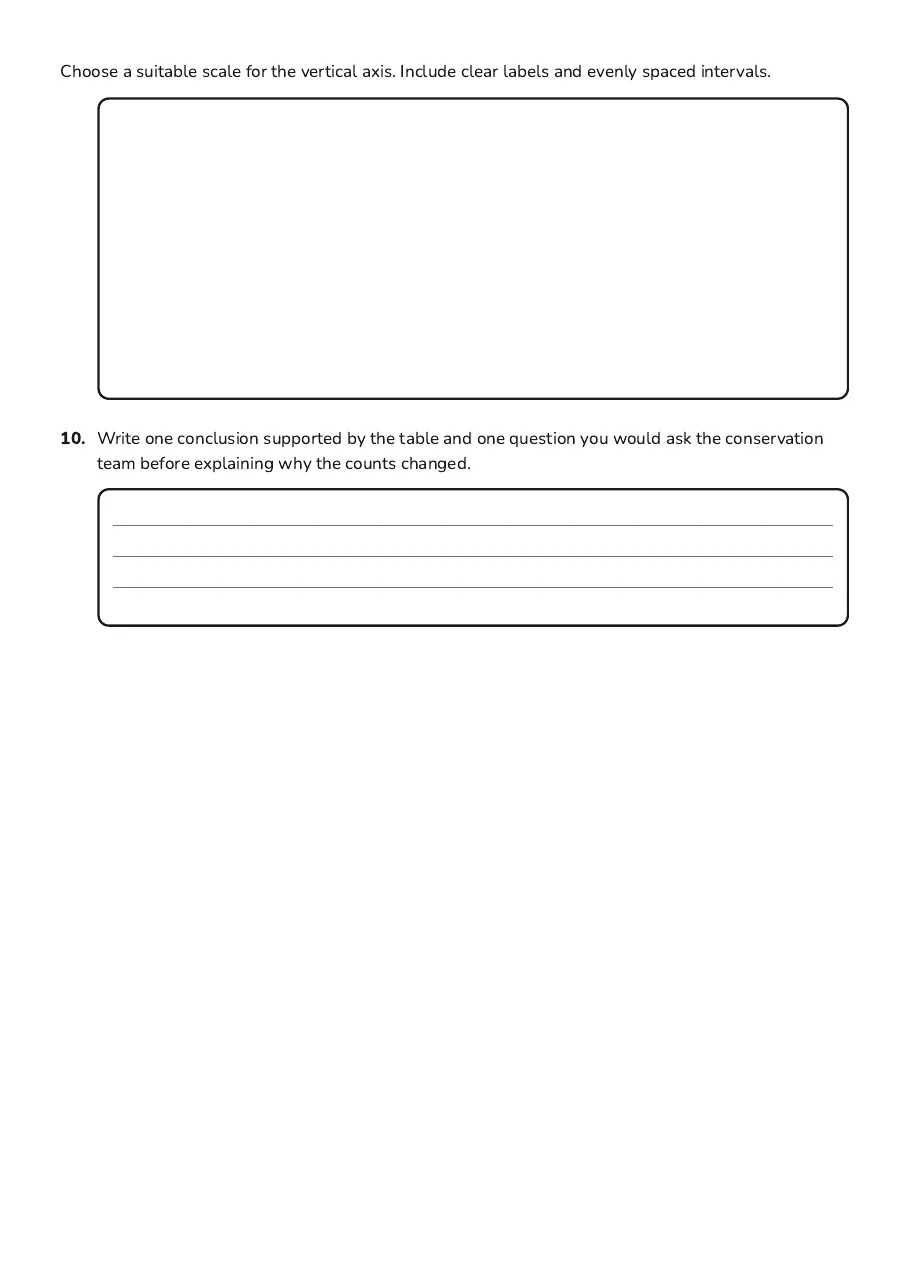
Choose a suitable scale for the vertical axis. Include clear labels and evenly spaced intervals.
10.Write one conclusion supported by the table and one question you would ask the conservation team before explaining why the counts changed.

3 printable pages

  • Endangered Species Data Investigation, page 1 of 3: Read the data

    Page 1

  • Endangered Species Data Investigation, page 2 of 3: Make sense of the investigation

    Page 2

  • Endangered Species Data Investigation, page 3 of 3: Choose a suitable scale for the vertical axis. Include clear labels and evenly spaced…

    Page 3

About This Worksheet

Free in Kuraplan

Sign up free, grab the PDF, and customize it for your class.

Print-Ready

Formatted for standard paper. Clean layout, easy to read.

AI-Generated

Created with Kuraplan's AI, designed for real classroom use.

For Teachers & Parents

Use in classrooms, for homework, tutoring, or homeschool.

Need a custom version of this worksheet?

Kuraplan's AI generates custom worksheets in seconds — differentiated for every learner, aligned to your curriculum.

Generate Custom Worksheets — Free
No credit card Curriculum-aligned Under 60 seconds