MathsFreePrintable
Exponential Functions and Graphs
A free maths worksheet ready for your classroom. Open in Kuraplan to grab the print-ready PDF, customize it for your students, or generate a fresh version in seconds.

Name:Date:
Exponential Functions and Graphs
A community recycling drive is tracking how its online sign-ups and uncollected waste change over time. Use exponential functions, tables and graphs to analyse the data. Give exact values where possible and round decimals to 2 decimal places.
Recognise and represent
1.The number of people signed up is modelled by S(t) = 80(1.25)^t, where t is the number of weeks since launch. Which statement best describes the model?
- The number increases by 25 people each week.
- The number is multiplied by 1.25 each week, so it grows by 25% per week.
- The number decreases by 25% each week.
- The number starts at 1.25 people.
2.For S(t) = 80(1.25)^t, state the initial number of sign-ups, the weekly growth rate as a percentage, and the number predicted after 4 weeks.
3.A recycling team records 120 kg of material remaining to be sorted. Each day, the remaining amount is 70% of the previous day's amount. Write a function R(d) for the amount after d days, and identify the decay rate.
Tables and graph features
4.Complete the value table for f(x) = 2^x using the given x-values. Then draw Cartesian axes with x-values from -2 to 2 and y-values from 0 to 4, plot the points, and sketch a smooth curve.
x
f(x) = 2^x
-2
-1
0
1
2
5.For g(x) = (1/2)^x, calculate g(x) for x = -2, -1, 0, 1, 2. State whether it shows growth or decay, and give its horizontal asymptote.
6.Which features are true for y = a^x when a > 1? Select all that apply.
- The y-intercept is (0, 1).
- The graph has horizontal asymptote y = 0.
- The graph passes through (1, 0).
- The function is increasing for all real x.
- The range is y > 0.
7.Compare y = 3^x with y = 2^x for x > 0. Which graph rises more steeply, and what do they have in common?
Transformations and applications
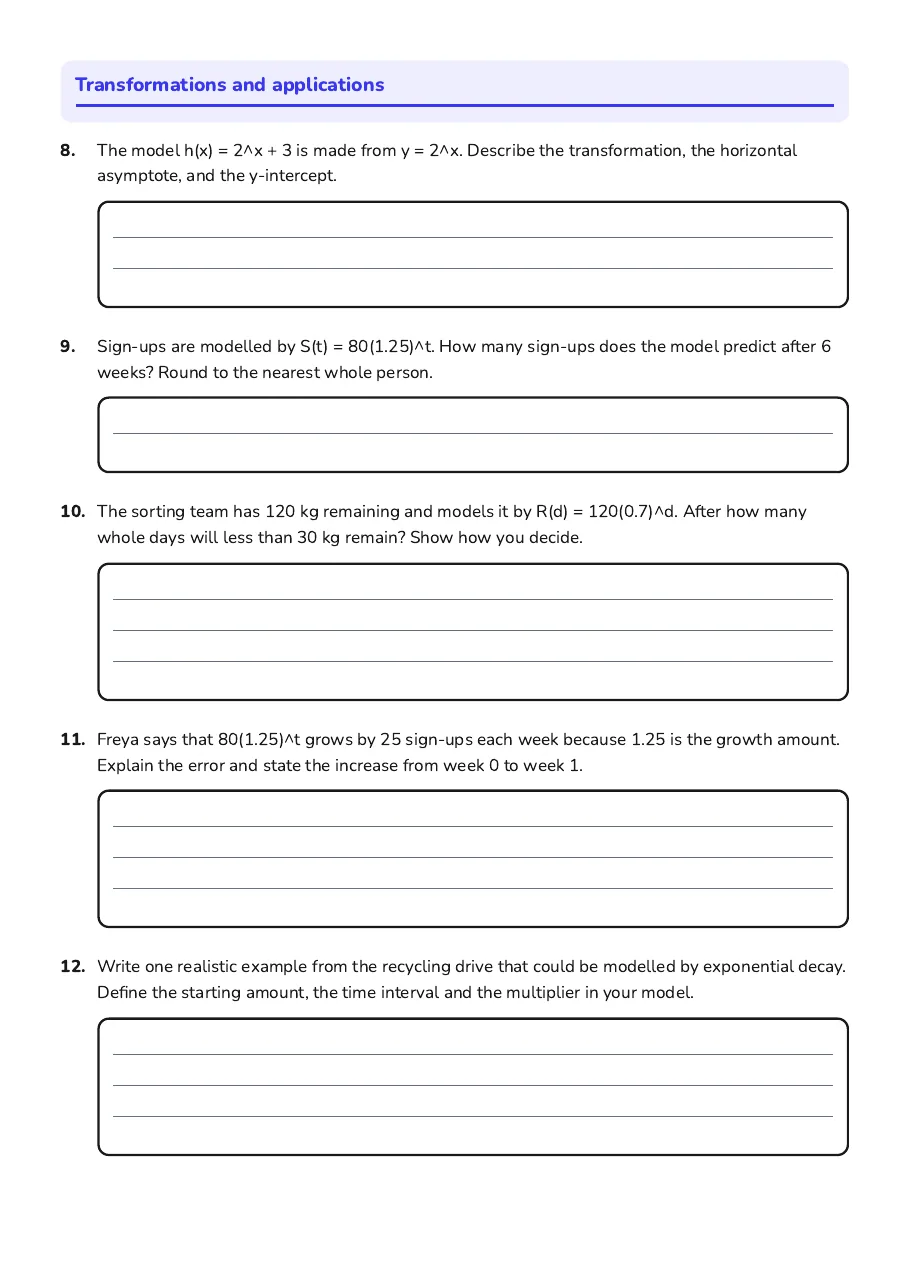
8.The model h(x) = 2^x + 3 is made from y = 2^x. Describe the transformation, the horizontal asymptote, and the y-intercept.
9.Sign-ups are modelled by S(t) = 80(1.25)^t. How many sign-ups does the model predict after 6 weeks? Round to the nearest whole person.
10.The sorting team has 120 kg remaining and models it by R(d) = 120(0.7)^d. After how many whole days will less than 30 kg remain? Show how you decide.
11.Freya says that 80(1.25)^t grows by 25 sign-ups each week because 1.25 is the growth amount. Explain the error and state the increase from week 0 to week 1.
12.Write one realistic example from the recycling drive that could be modelled by exponential decay. Define the starting amount, the time interval and the multiplier in your model.
3 printable pages

Page 1

Page 2
Page 3
About This Worksheet
Free in Kuraplan
Sign up free, grab the PDF, and customize it for your class.
Print-Ready
Formatted for standard paper. Clean layout, easy to read.
AI-Generated
Created with Kuraplan's AI, designed for real classroom use.
For Teachers & Parents
Use in classrooms, for homework, tutoring, or homeschool.
Need a custom version of this worksheet?
Kuraplan's AI generates custom worksheets in seconds — differentiated for every learner, aligned to your curriculum.
Generate Custom Worksheets — Free No credit card Curriculum-aligned Under 60 seconds