MathsFreePrintable
Favourite Foods Data Table
A free maths worksheet ready for your classroom. Open in Kuraplan to grab the print-ready PDF, customize it for your students, or generate a fresh version in seconds.
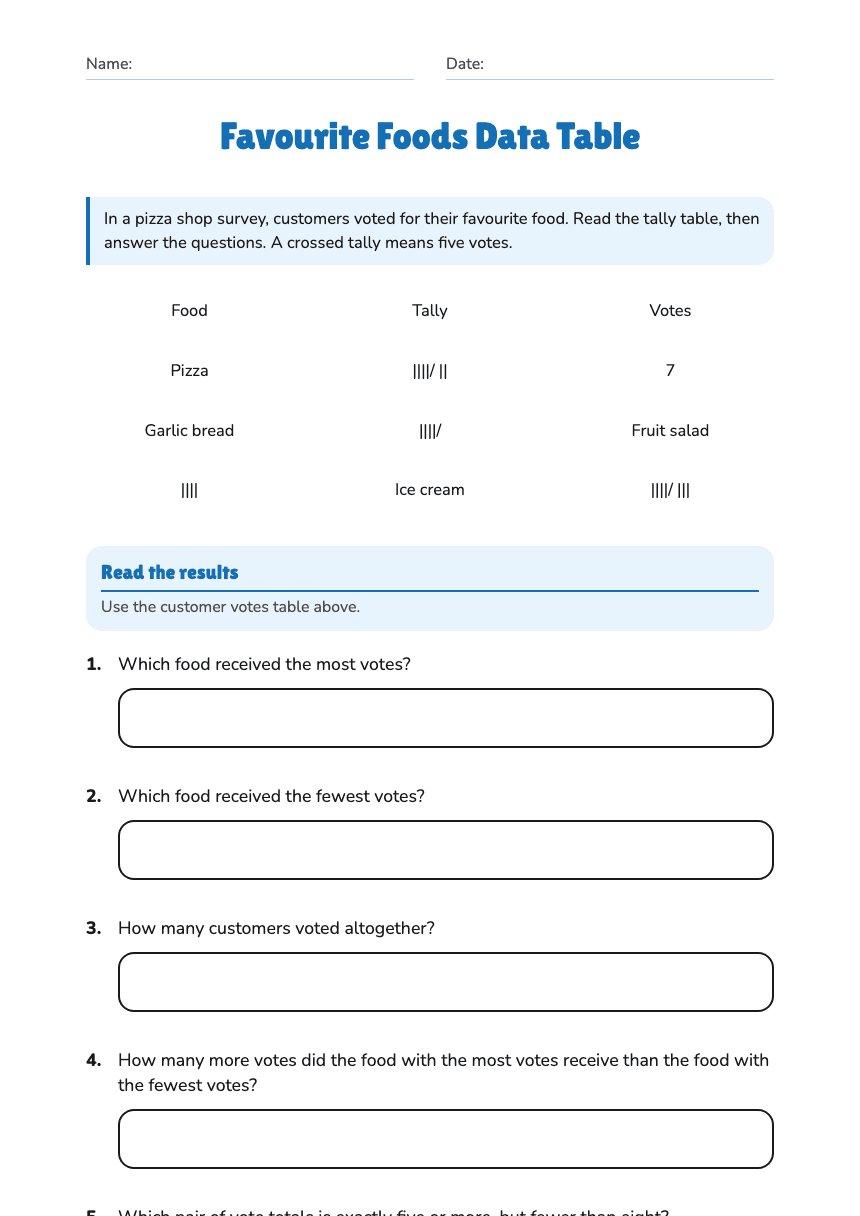
Name:Date:
Favourite Foods Data Table
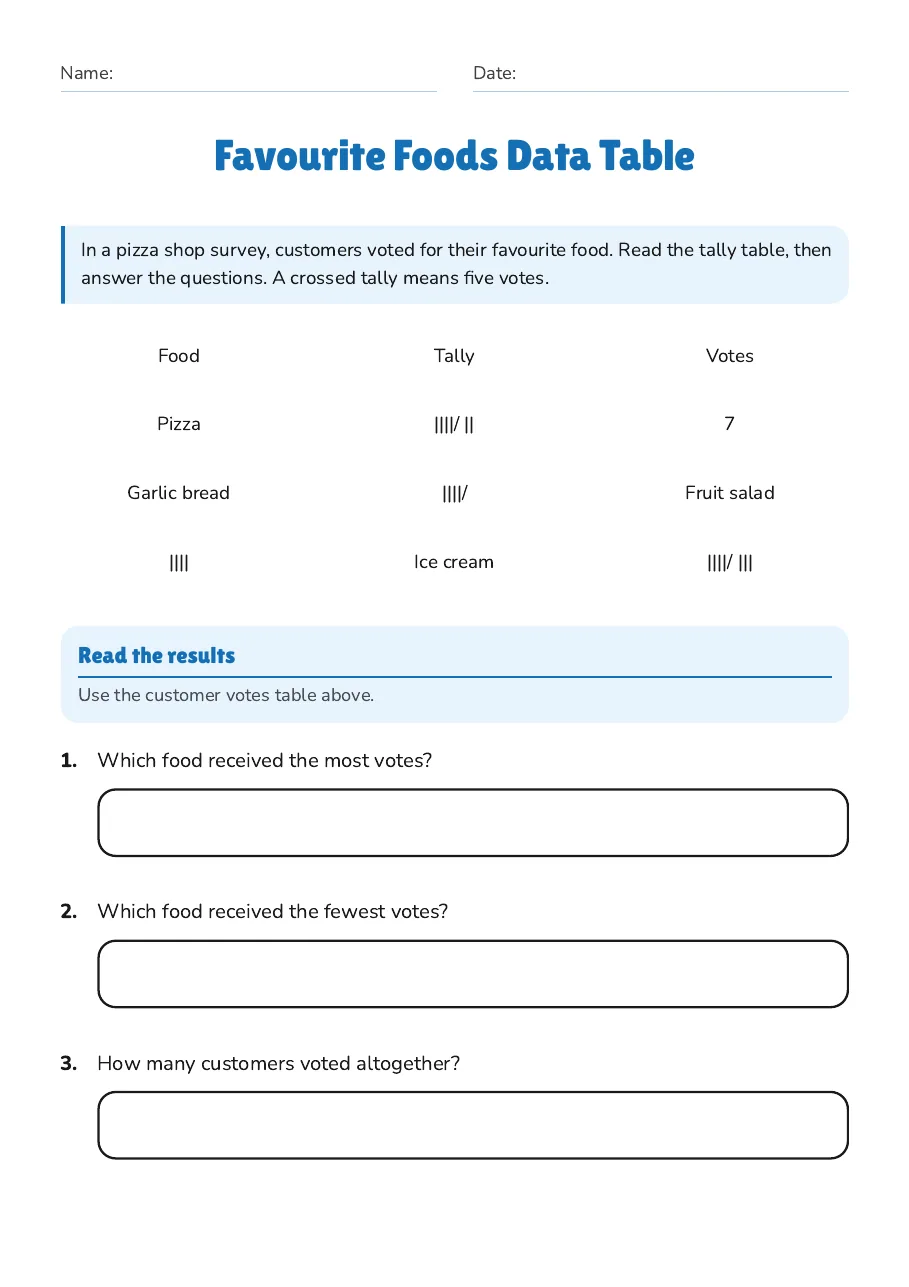
In a pizza shop survey, customers voted for their favourite food. Read the tally table, then answer the questions. A crossed tally means five votes.
Food
Tally
Votes
Pizza
||||/ ||
7
Garlic bread
||||/
Fruit salad
||||
Ice cream
||||/ |||
Read the results
Use the customer votes table above.
1.Which food received the most votes?
2.Which food received the fewest votes?
3.How many customers voted altogether?
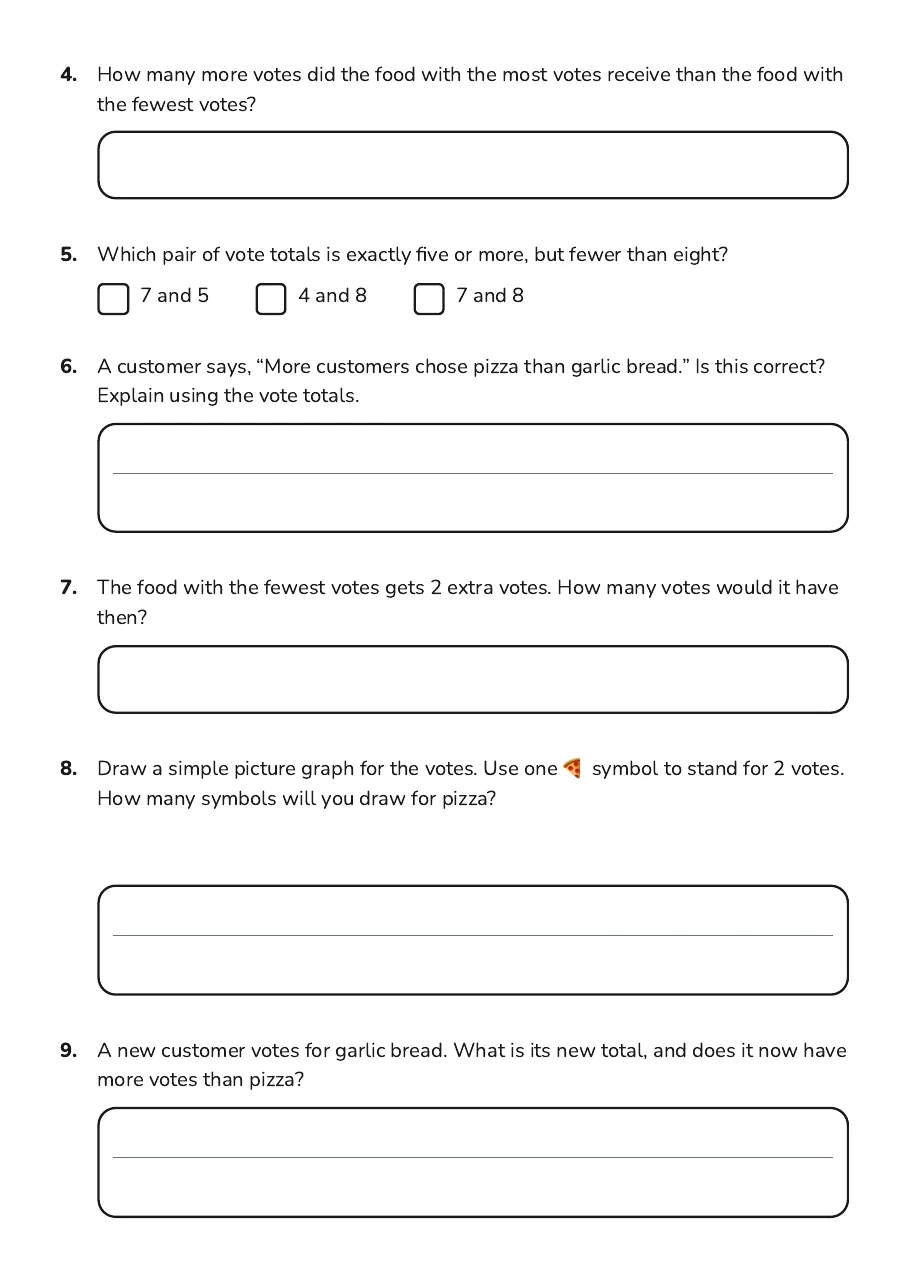
4.How many more votes did the food with the most votes receive than the food with the fewest votes?
5.Which pair of vote totals is exactly five or more, but fewer than eight?
- 7 and 5
- 4 and 8
- 7 and 8
6.A customer says, “More customers chose pizza than garlic bread.” Is this correct? Explain using the vote totals.
7.The food with the fewest votes gets 2 extra votes. How many votes would it have then?
8.Draw a simple picture graph for the votes. Use one 🍕 symbol to stand for 2 votes. How many symbols will you draw for pizza?
9.A new customer votes for garlic bread. What is its new total, and does it now have more votes than pizza?
2 printable pages
Page 1
Page 2
About This Worksheet
Free in Kuraplan
Sign up free, grab the PDF, and customize it for your class.
Print-Ready
Formatted for standard paper. Clean layout, easy to read.
AI-Generated
Created with Kuraplan's AI, designed for real classroom use.
For Teachers & Parents
Use in classrooms, for homework, tutoring, or homeschool.
Need a custom version of this worksheet?
Kuraplan's AI generates custom worksheets in seconds — differentiated for every learner, aligned to your curriculum.
Generate Custom Worksheets — Free No credit card Curriculum-aligned Under 60 seconds