MathsFreePrintable

Graphs & Data Insights

A free maths worksheet ready for your classroom. Open in Kuraplan to grab the print-ready PDF, customize it for your students, or generate a fresh version in seconds.
Graphs & Data Insights worksheet preview
Name:Date:

Graphs & Data Insights

Read each data display carefully. Show your working for calculations. Remember: the range is the largest value minus the smallest value.

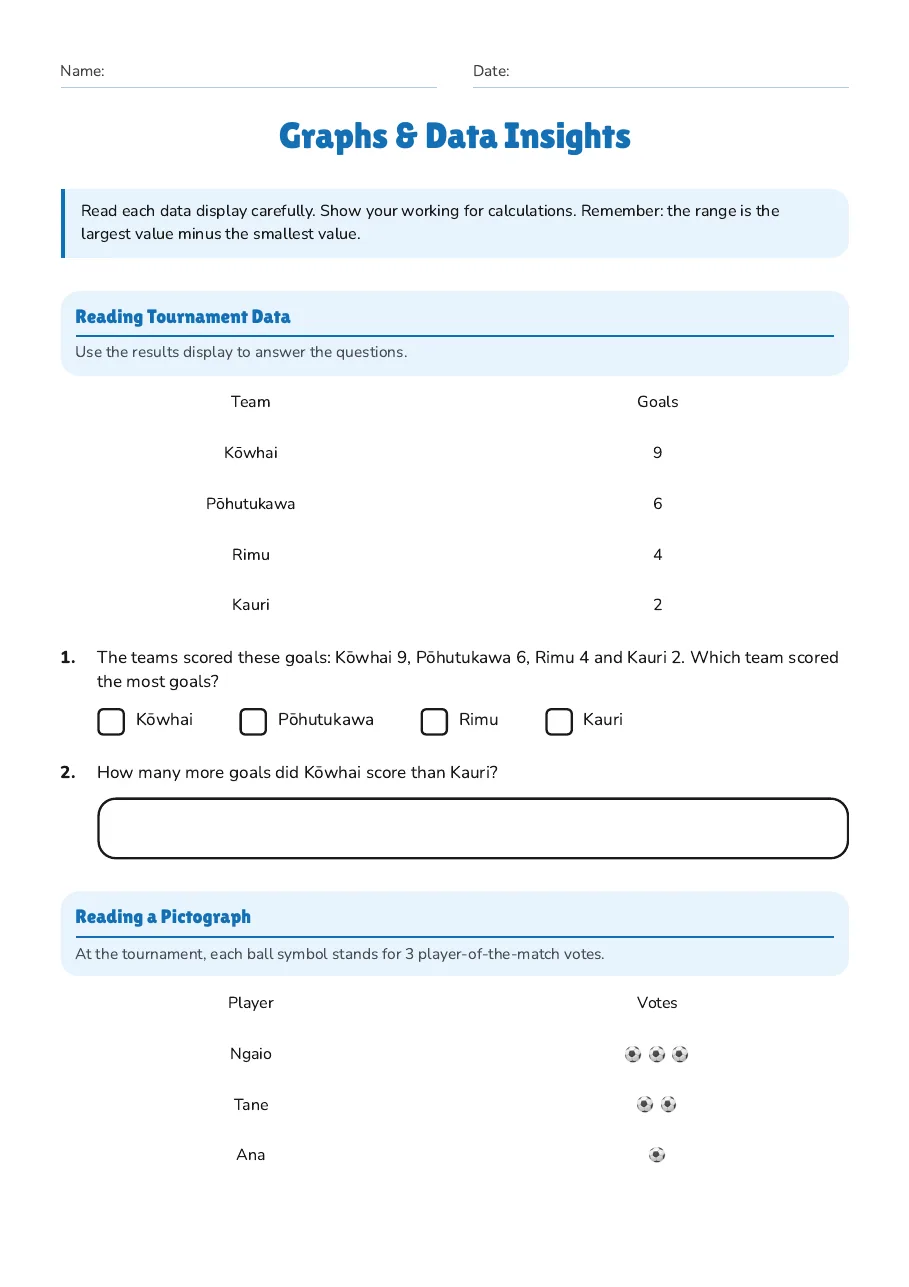
Reading Tournament Data

Use the results display to answer the questions.

Team

Goals

Kōwhai

9

Pōhutukawa

6

Rimu

4

Kauri

2

1.The teams scored these goals: Kōwhai 9, Pōhutukawa 6, Rimu 4 and Kauri 2. Which team scored the most goals?
  • Kōwhai
  • Pōhutukawa
  • Rimu
  • Kauri
2.How many more goals did Kōwhai score than Kauri?

Reading a Pictograph

At the tournament, each ball symbol stands for 3 player-of-the-match votes.

Player

Votes

Ngaio

⚽ ⚽ ⚽

Tane

⚽ ⚽

Ana

⚽

3.How many votes did Ngaio receive if each ⚽ represents 3 votes?
4.Which player received the most votes in the pictograph?
  • Ngaio
  • Tane
  • Ana

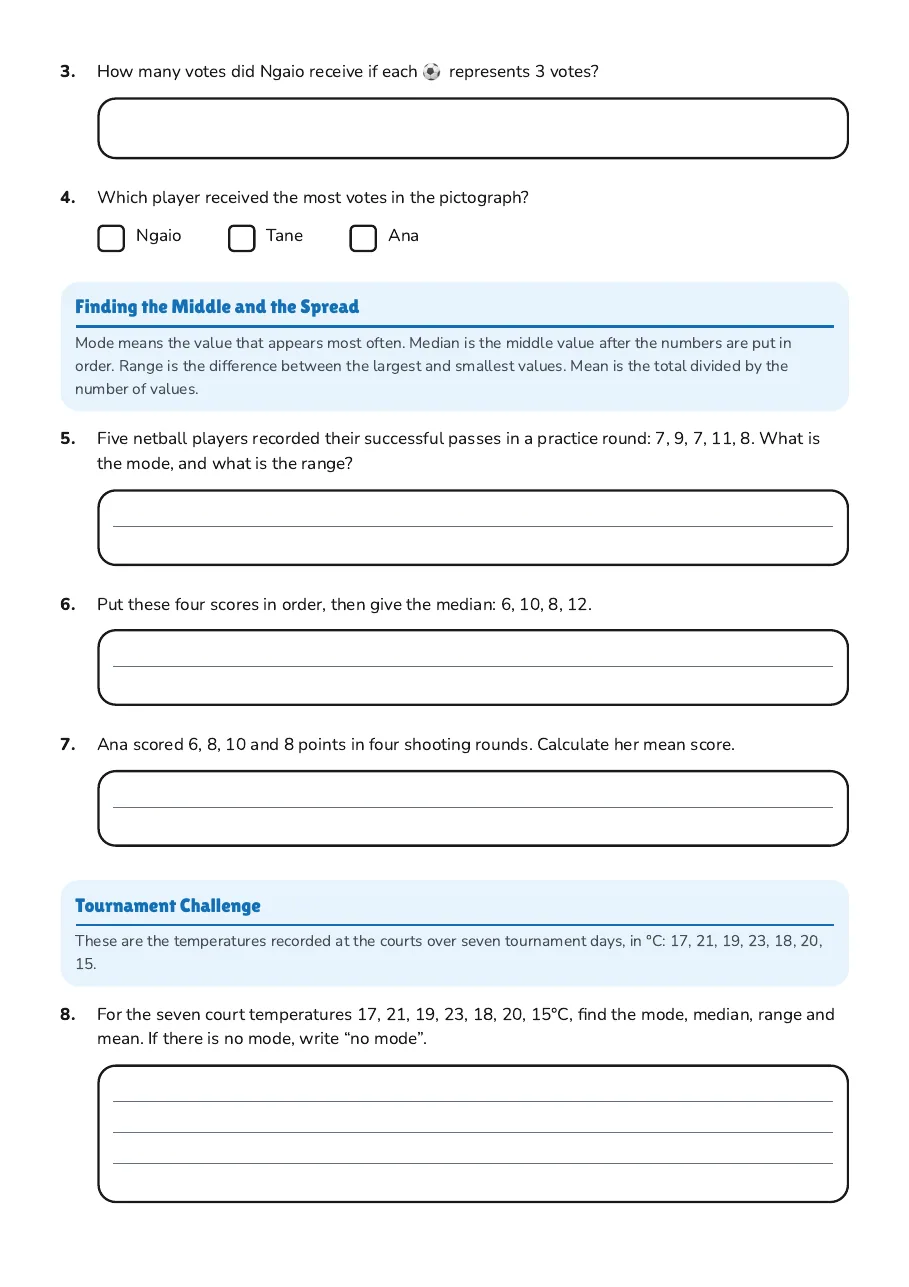
Finding the Middle and the Spread

Mode means the value that appears most often. Median is the middle value after the numbers are put in order. Range is the difference between the largest and smallest values. Mean is the total divided by the number of values.

5.Five netball players recorded their successful passes in a practice round: 7, 9, 7, 11, 8. What is the mode, and what is the range?
6.Put these four scores in order, then give the median: 6, 10, 8, 12.
7.Ana scored 6, 8, 10 and 8 points in four shooting rounds. Calculate her mean score.

Tournament Challenge

These are the temperatures recorded at the courts over seven tournament days, in °C: 17, 21, 19, 23, 18, 20, 15.

8.For the seven court temperatures 17, 21, 19, 23, 18, 20, 15°C, find the mode, median, range and mean. If there is no mode, write “no mode”.
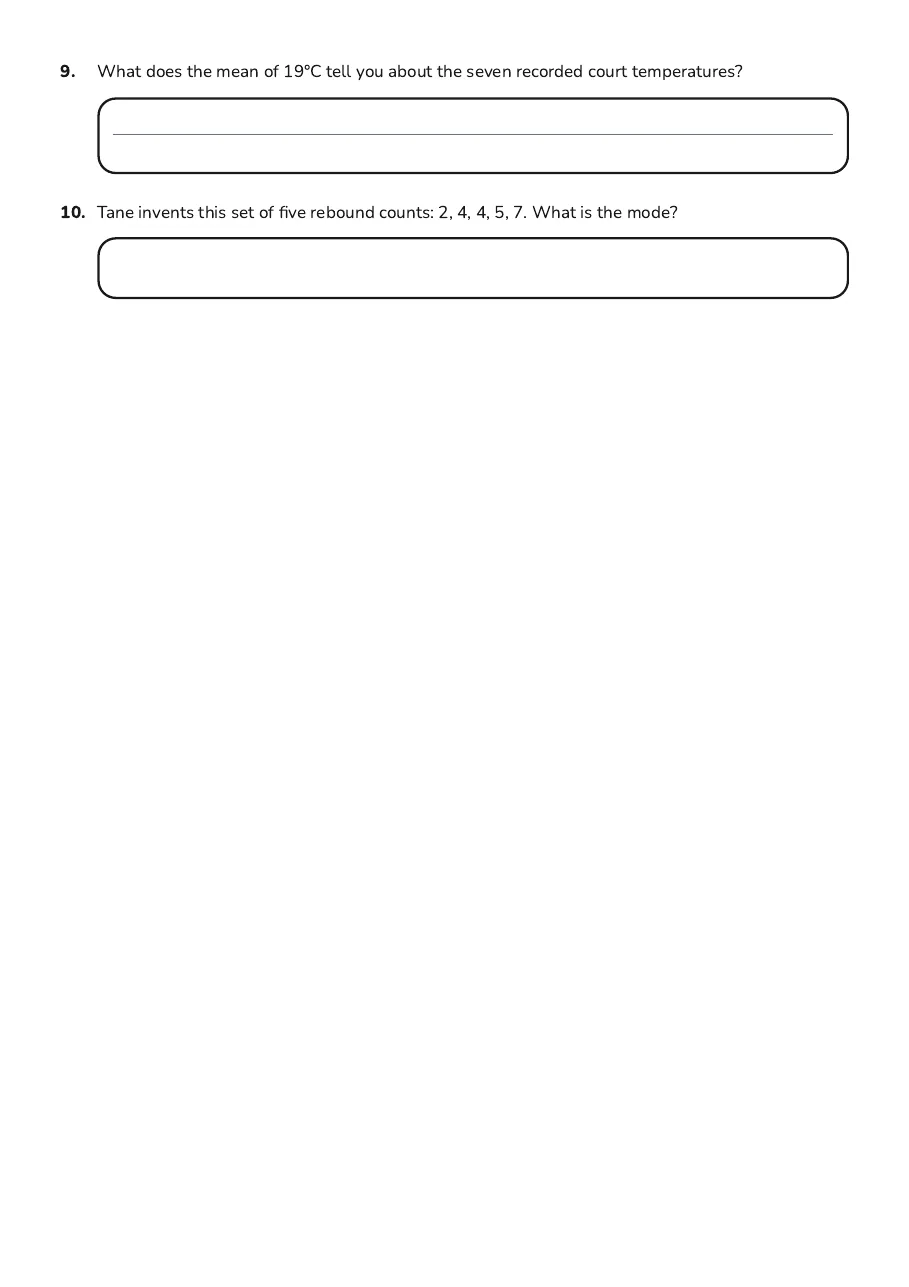
9.What does the mean of 19°C tell you about the seven recorded court temperatures?
10.Tane invents this set of five rebound counts: 2, 4, 4, 5, 7. What is the mode?

3 printable pages

  • Graphs & Data Insights, page 1 of 3: Reading Tournament Data, Reading a Pictograph

    Page 1

  • Graphs & Data Insights, page 2 of 3: Finding the Middle and the Spread, Tournament Challenge

    Page 2

  • Graphs & Data Insights, page 3 of 3: 9. What does the mean of 19°C tell you about the seven recorded court temperatures?

    Page 3

About This Worksheet

Free in Kuraplan

Sign up free, grab the PDF, and customize it for your class.

Print-Ready

Formatted for standard paper. Clean layout, easy to read.

AI-Generated

Created with Kuraplan's AI, designed for real classroom use.

For Teachers & Parents

Use in classrooms, for homework, tutoring, or homeschool.

Need a custom version of this worksheet?

Kuraplan's AI generates custom worksheets in seconds — differentiated for every learner, aligned to your curriculum.

Generate Custom Worksheets — Free
No credit card Curriculum-aligned Under 60 seconds