Penguin Statistics Inference Review
A free maths worksheet ready for your classroom. Open in Kuraplan to grab the print-ready PDF, customize it for your students, or generate a fresh version in seconds.
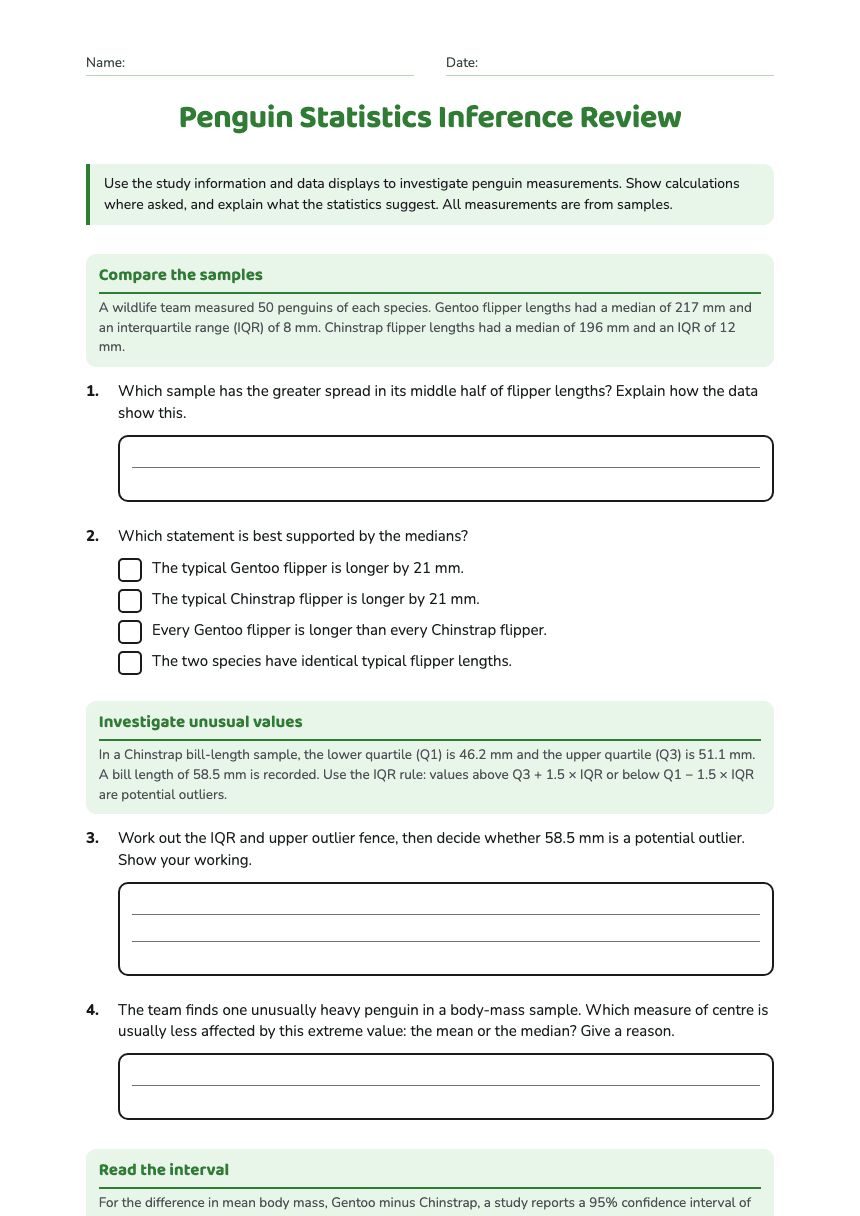
Penguin Statistics Inference Review
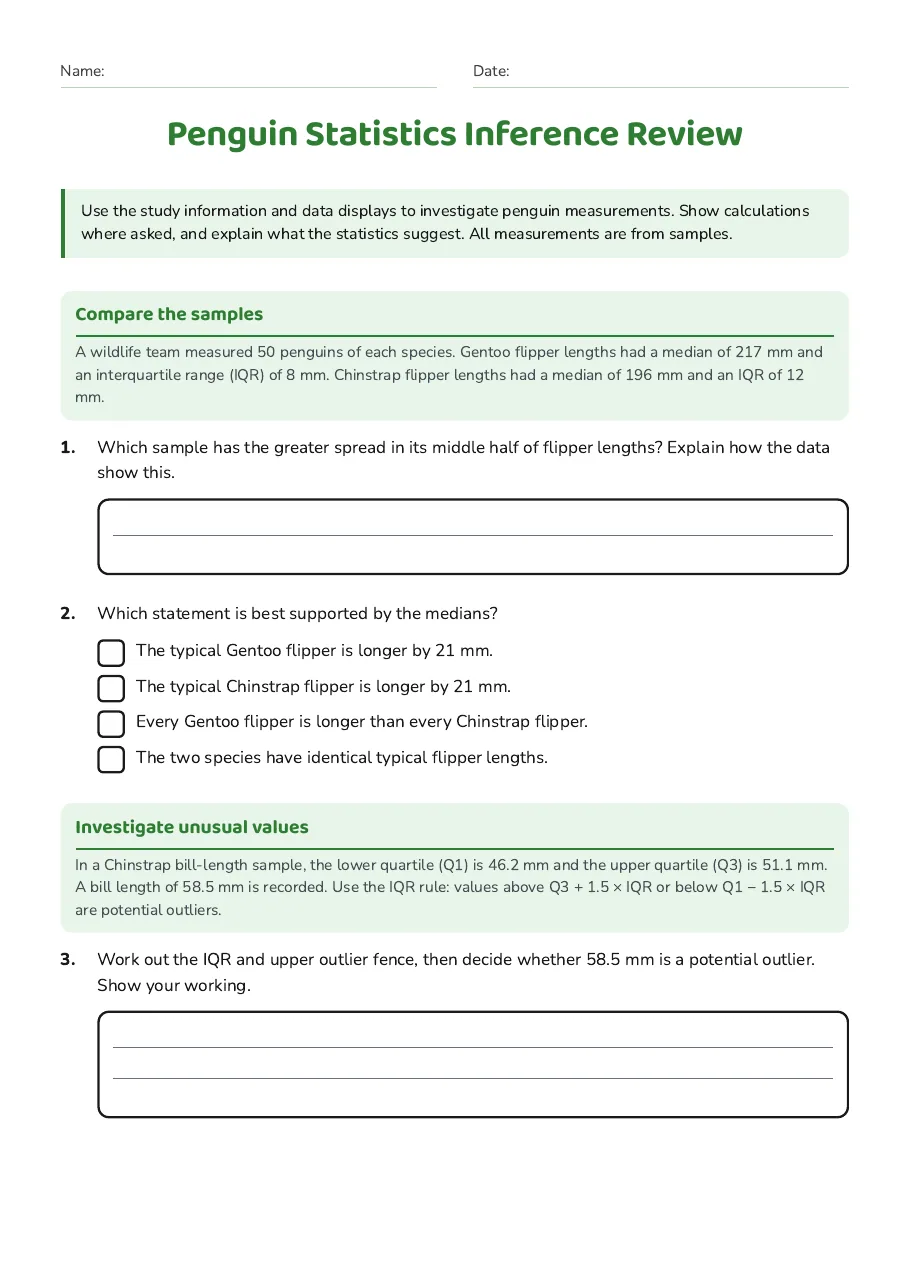
Compare the samples
A wildlife team measured 50 penguins of each species. Gentoo flipper lengths had a median of 217 mm and an interquartile range (IQR) of 8 mm. Chinstrap flipper lengths had a median of 196 mm and an IQR of 12 mm.
- The typical Gentoo flipper is longer by 21 mm.
- The typical Chinstrap flipper is longer by 21 mm.
- Every Gentoo flipper is longer than every Chinstrap flipper.
- The two species have identical typical flipper lengths.
Investigate unusual values
In a Chinstrap bill-length sample, the lower quartile (Q1) is 46.2 mm and the upper quartile (Q3) is 51.1 mm. A bill length of 58.5 mm is recorded. Use the IQR rule: values above Q3 + 1.5 × IQR or below Q1 − 1.5 × IQR are potential outliers.
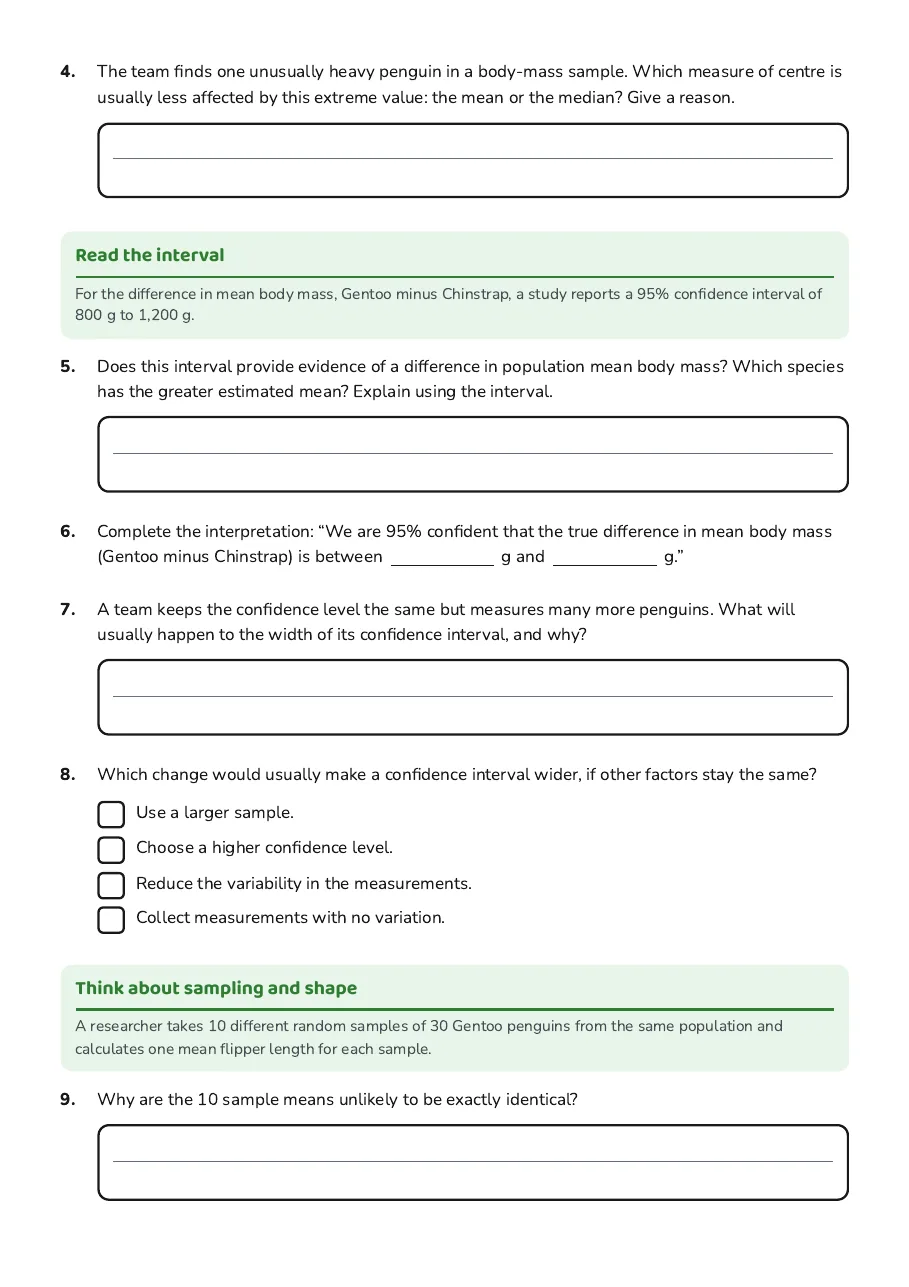
Read the interval
For the difference in mean body mass, Gentoo minus Chinstrap, a study reports a 95% confidence interval of 800 g to 1,200 g.
- Use a larger sample.
- Choose a higher confidence level.
- Reduce the variability in the measurements.
- Collect measurements with no variation.
Think about sampling and shape
A researcher takes 10 different random samples of 30 Gentoo penguins from the same population and calculates one mean flipper length for each sample.
3 printable pages
Page 1
Page 2
Page 3
About This Worksheet
Free in Kuraplan
Sign up free, grab the PDF, and customize it for your class.
Print-Ready
Formatted for standard paper. Clean layout, easy to read.
AI-Generated
Created with Kuraplan's AI, designed for real classroom use.
For Teachers & Parents
Use in classrooms, for homework, tutoring, or homeschool.
Need a custom version of this worksheet?
Kuraplan's AI generates custom worksheets in seconds — differentiated for every learner, aligned to your curriculum.
Generate Custom Worksheets — Free