MathsFreePrintable

Tainui History Data Collection

A free maths worksheet ready for your classroom. Open in Kuraplan to grab the print-ready PDF, customize it for your students, or generate a fresh version in seconds.
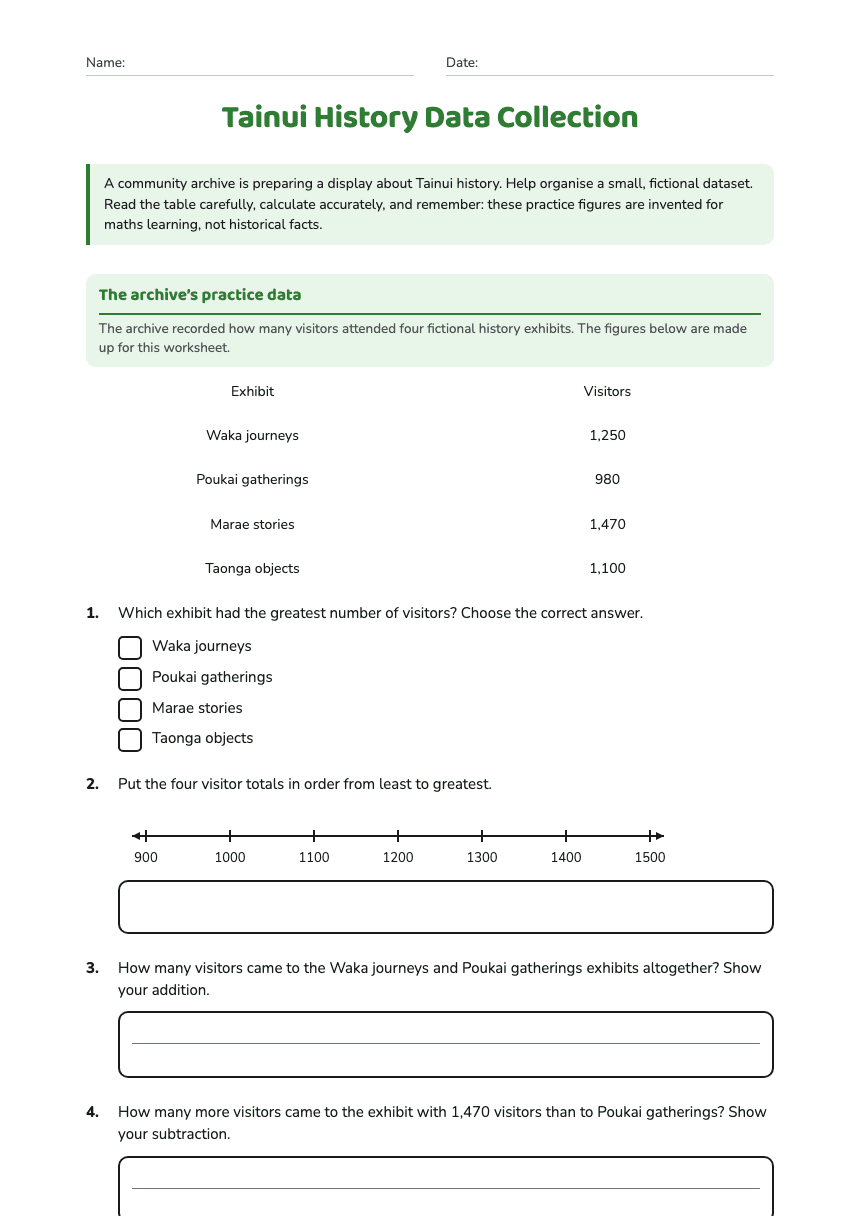
Tainui History Data Collection worksheet preview
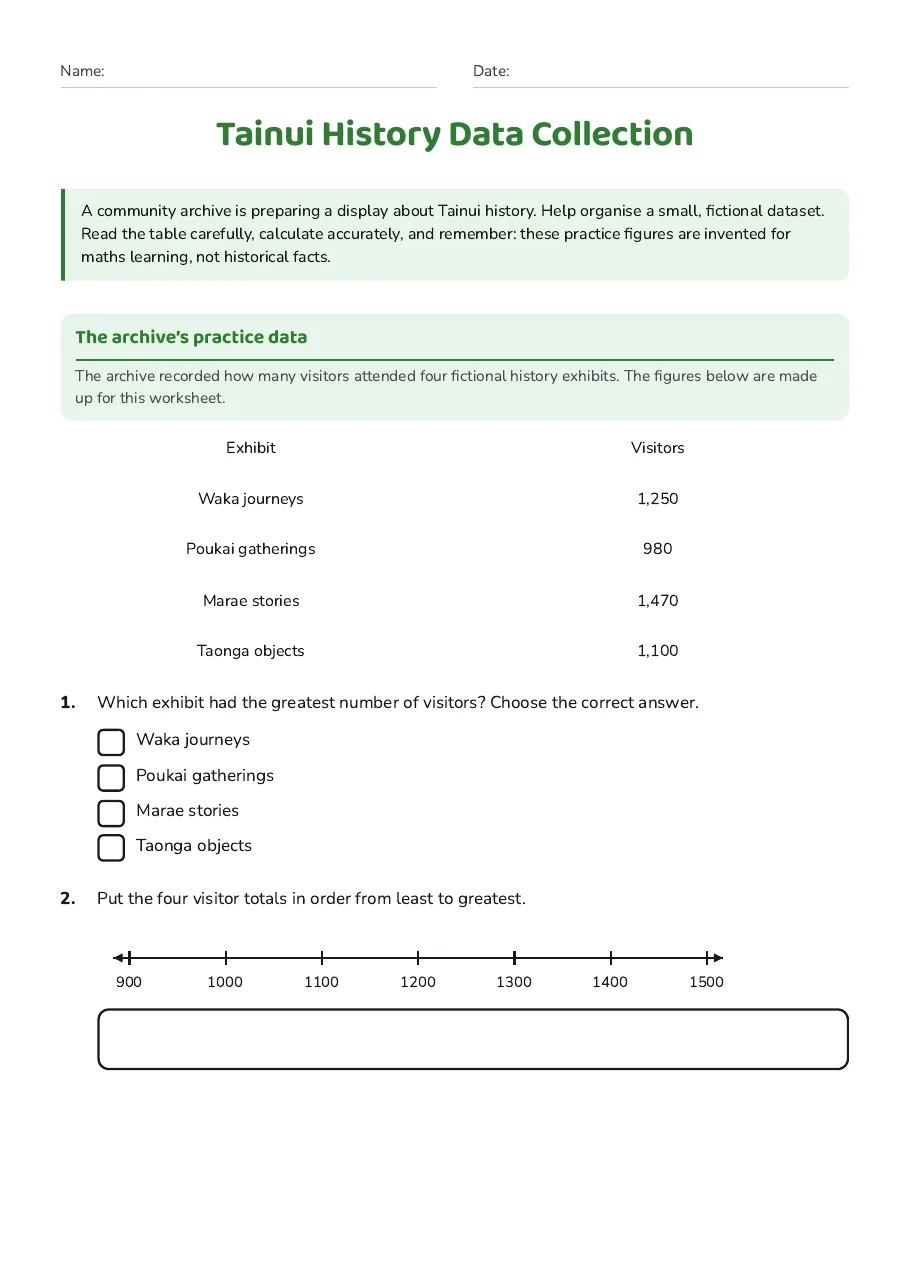
Name:Date:

Tainui History Data Collection

A community archive is preparing a display about Tainui history. Help organise a small, fictional dataset. Read the table carefully, calculate accurately, and remember: these practice figures are invented for maths learning, not historical facts.

The archive’s practice data

The archive recorded how many visitors attended four fictional history exhibits. The figures below are made up for this worksheet.

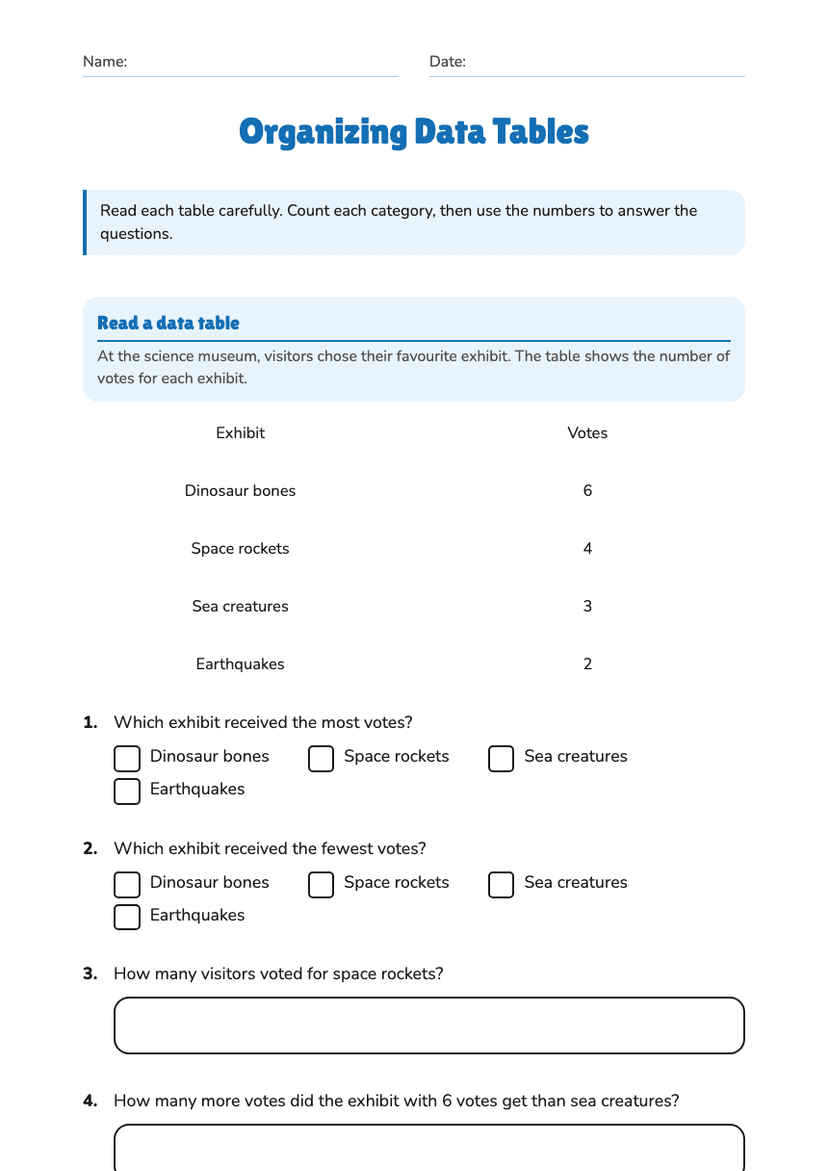
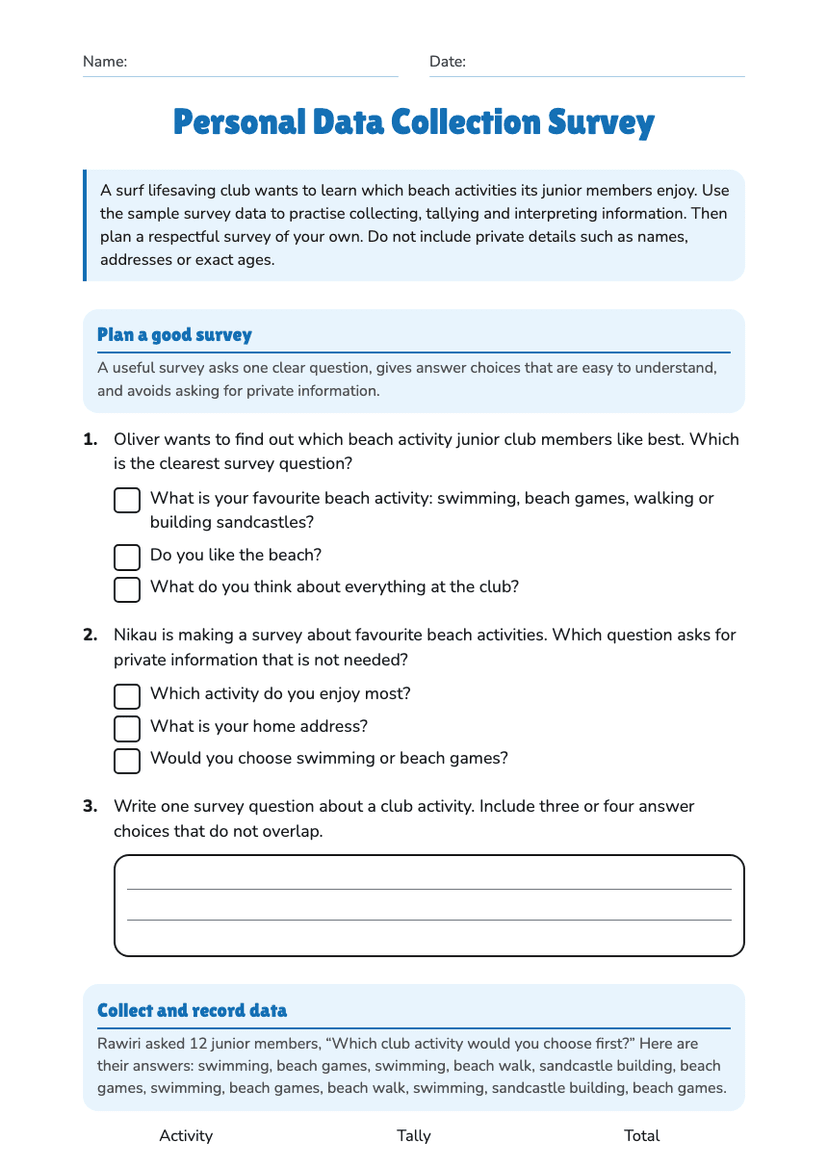
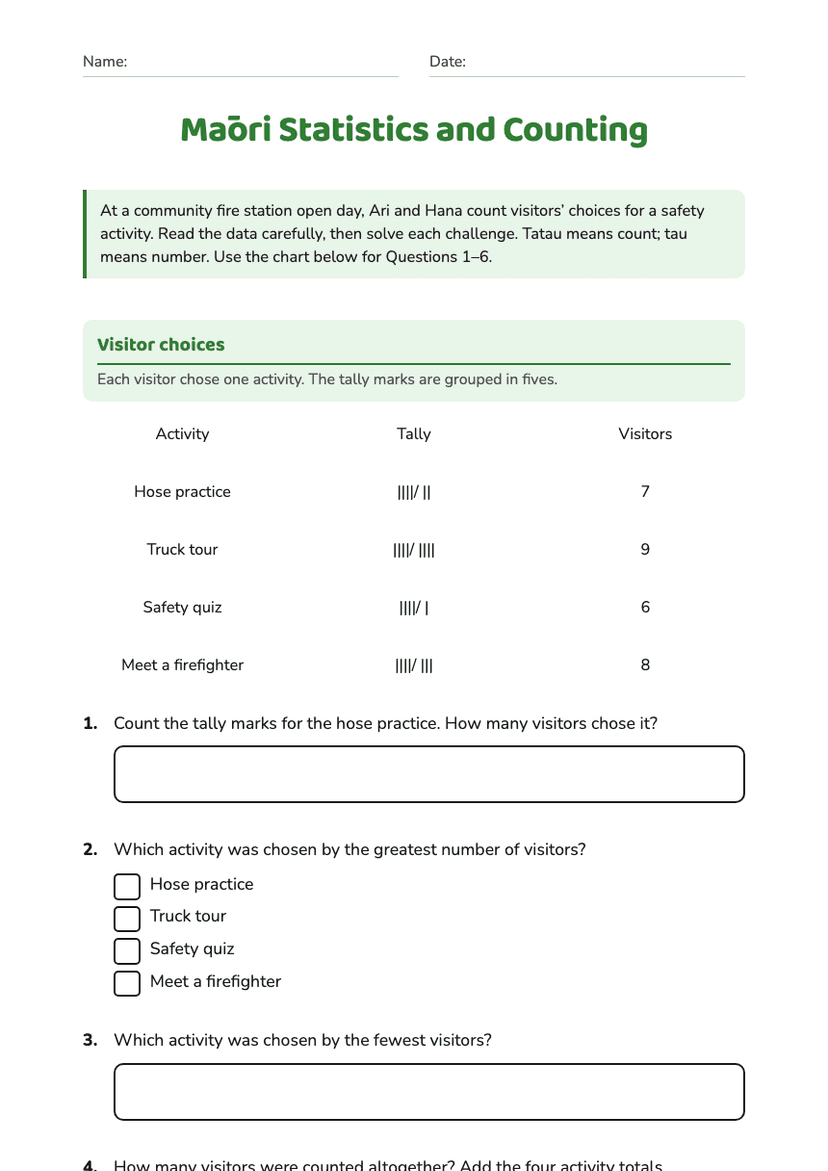
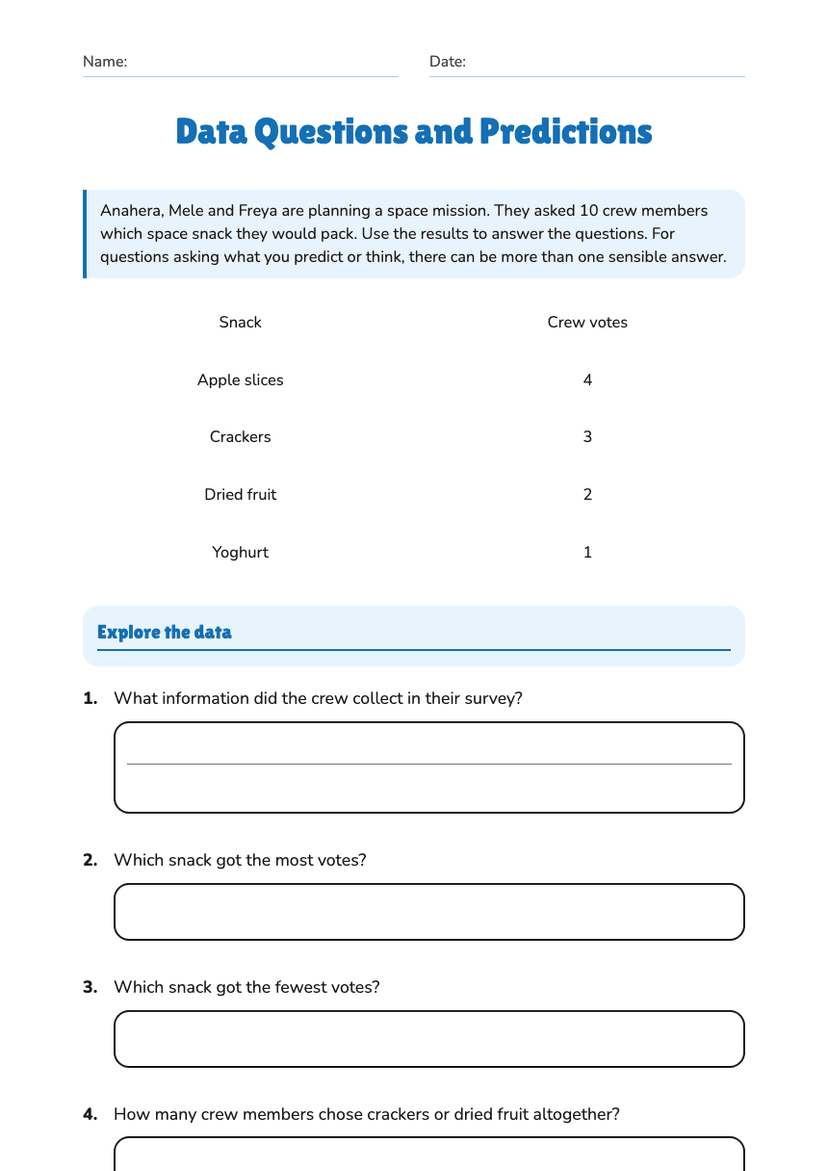
Exhibit

Visitors

Waka journeys

1,250

Poukai gatherings

980

Marae stories

1,470

Taonga objects

1,100

1.Which exhibit had the greatest number of visitors? Choose the correct answer.
  • Waka journeys
  • Poukai gatherings
  • Marae stories
  • Taonga objects
2.Put the four visitor totals in order from least to greatest.
900100011001200130014001500
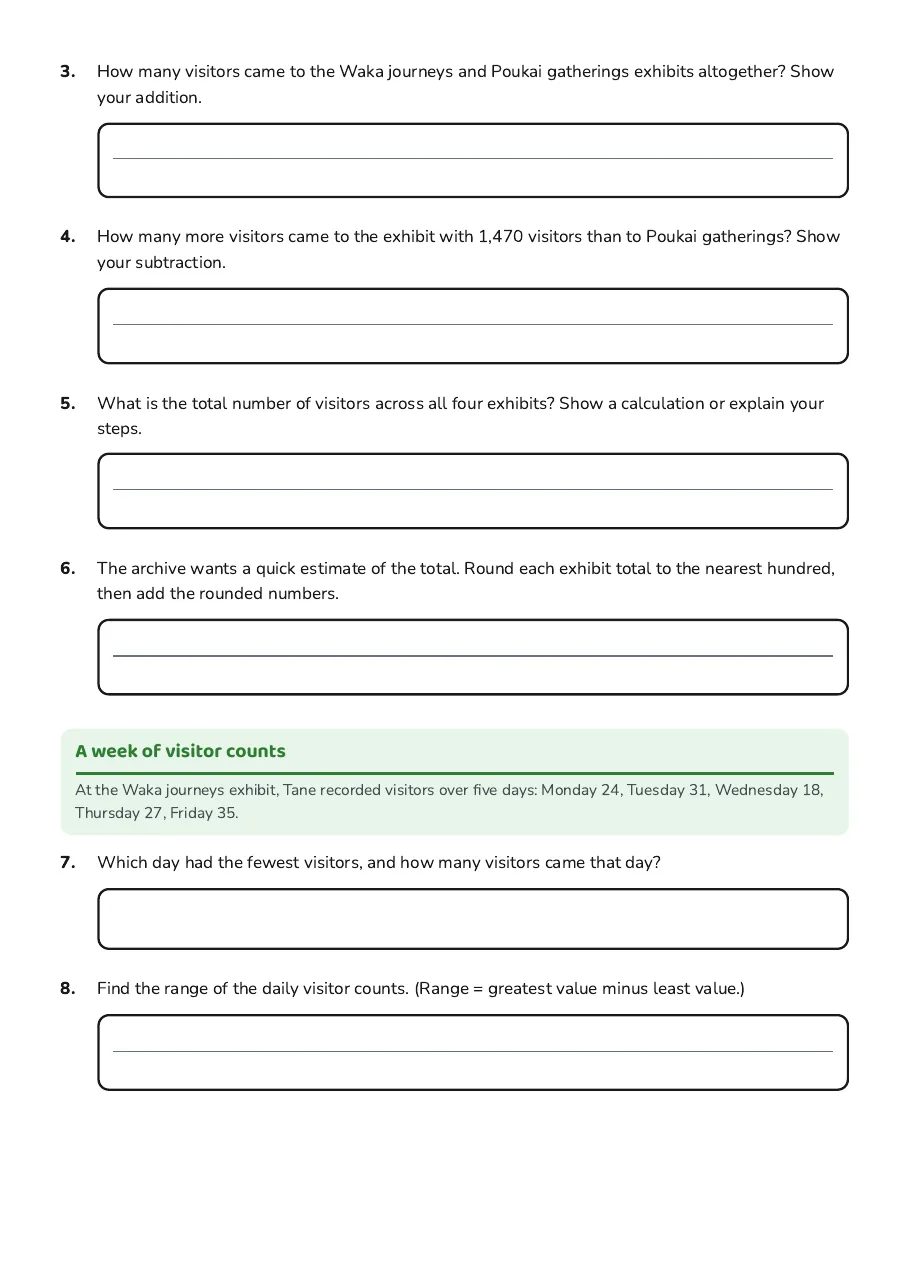
3.How many visitors came to the Waka journeys and Poukai gatherings exhibits altogether? Show your addition.
4.How many more visitors came to the exhibit with 1,470 visitors than to Poukai gatherings? Show your subtraction.
5.What is the total number of visitors across all four exhibits? Show a calculation or explain your steps.
6.The archive wants a quick estimate of the total. Round each exhibit total to the nearest hundred, then add the rounded numbers.

A week of visitor counts

At the Waka journeys exhibit, Tane recorded visitors over five days: Monday 24, Tuesday 31, Wednesday 18, Thursday 27, Friday 35.

7.Which day had the fewest visitors, and how many visitors came that day?
8.Find the range of the daily visitor counts. (Range = greatest value minus least value.)
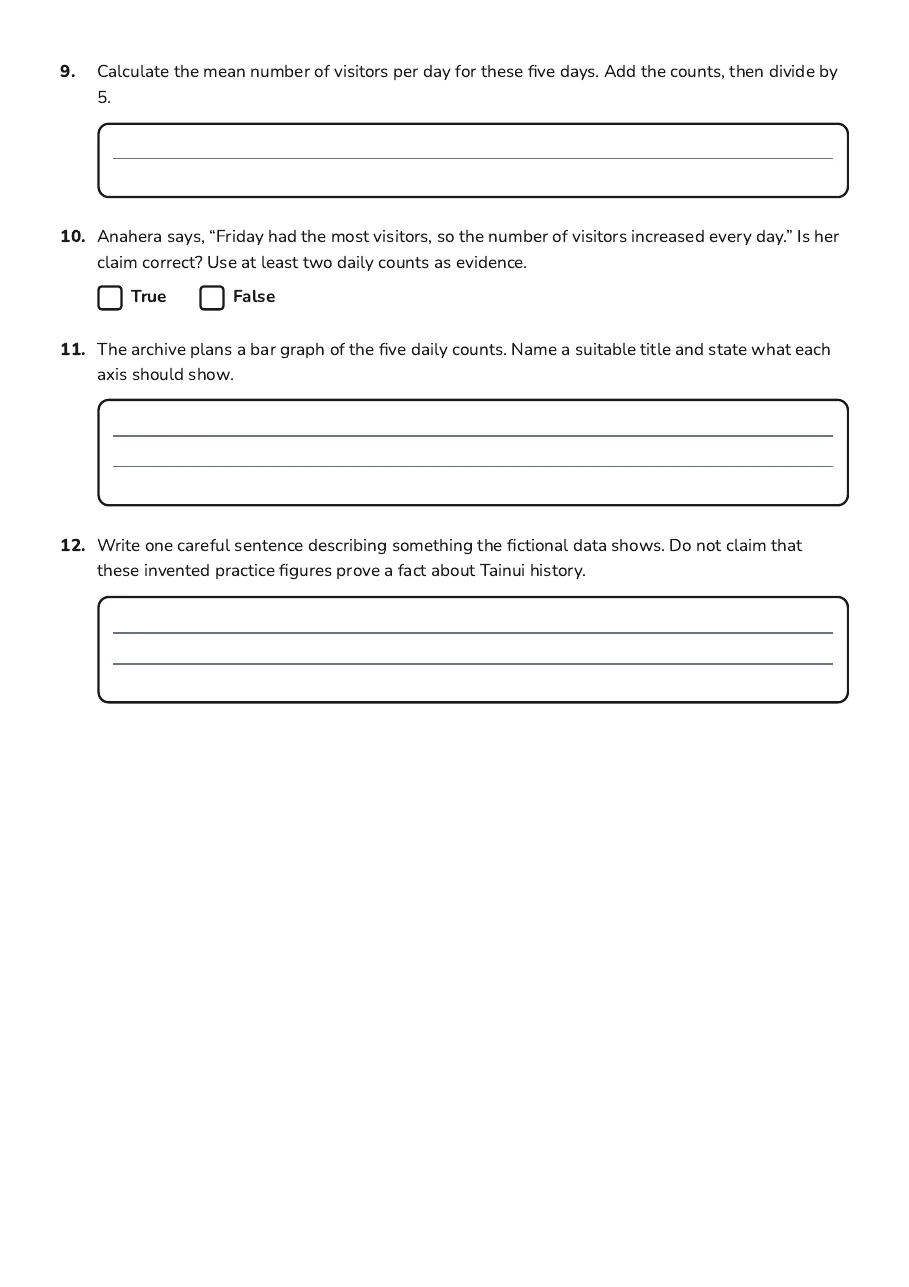
9.Calculate the mean number of visitors per day for these five days. Add the counts, then divide by 5.
10.Anahera says, “Friday had the most visitors, so the number of visitors increased every day.” Is her claim correct? Use at least two daily counts as evidence.
TrueFalse
11.The archive plans a bar graph of the five daily counts. Name a suitable title and state what each axis should show.
12.Write one careful sentence describing something the fictional data shows. Do not claim that these invented practice figures prove a fact about Tainui history.

3 printable pages

  • Tainui History Data Collection, page 1 of 3: The archive’s practice data

    Page 1

  • Tainui History Data Collection, page 2 of 3: A week of visitor counts

    Page 2

  • Tainui History Data Collection, page 3 of 3: 9. Calculate the mean number of visitors per day for these five days. Add the counts,…

    Page 3

About This Worksheet

Free in Kuraplan

Sign up free, grab the PDF, and customize it for your class.

Print-Ready

Formatted for standard paper. Clean layout, easy to read.

AI-Generated

Created with Kuraplan's AI, designed for real classroom use.

For Teachers & Parents

Use in classrooms, for homework, tutoring, or homeschool.

Need a custom version of this worksheet?

Kuraplan's AI generates custom worksheets in seconds — differentiated for every learner, aligned to your curriculum.

Generate Custom Worksheets — Free
No credit card Curriculum-aligned Under 60 seconds