MathsFreePrintable
Time-Series Data Insights
A free maths worksheet ready for your classroom. Open in Kuraplan to grab the print-ready PDF, customize it for your students, or generate a fresh version in seconds.

Name:Date:
Time-Series Data Insights
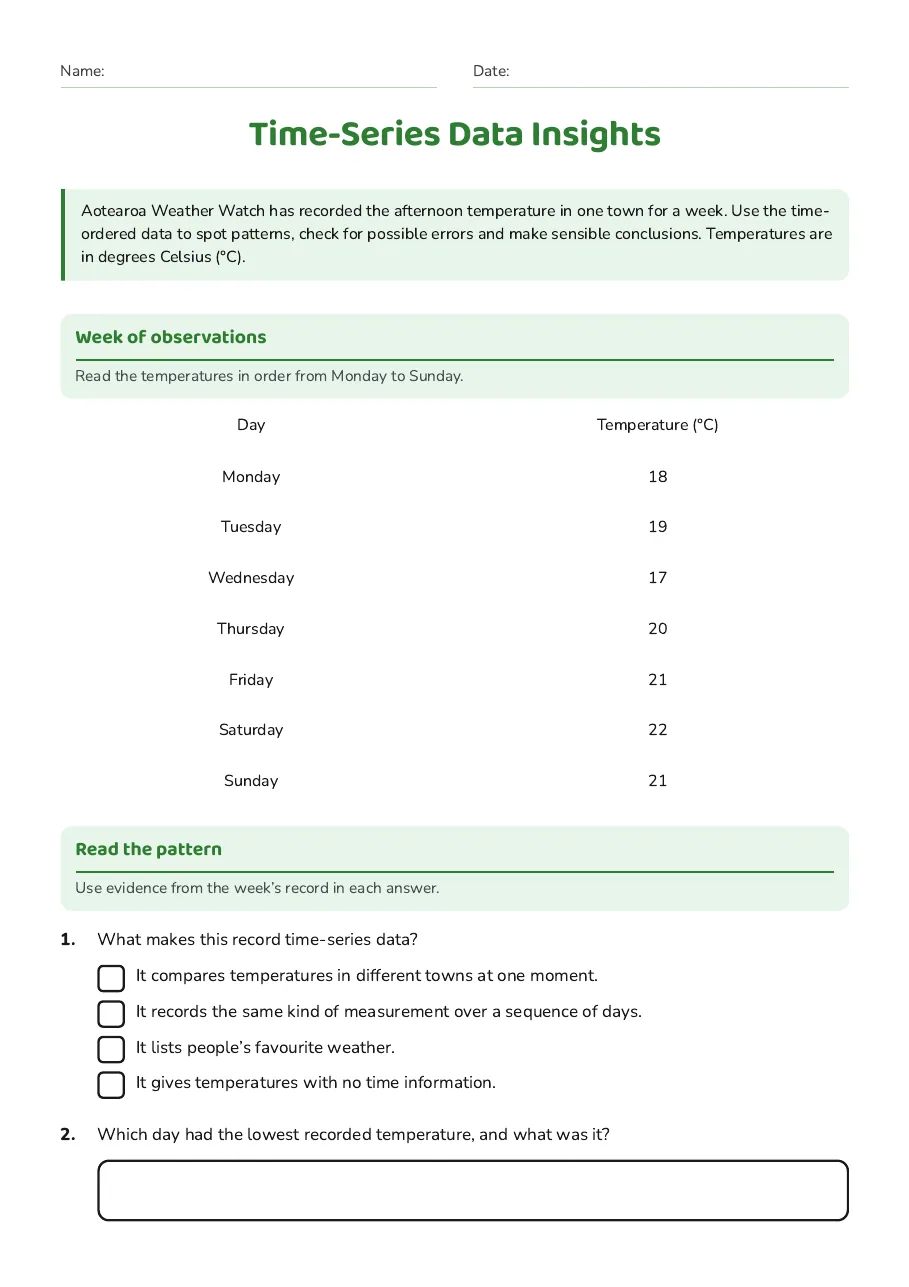
Aotearoa Weather Watch has recorded the afternoon temperature in one town for a week. Use the time-ordered data to spot patterns, check for possible errors and make sensible conclusions. Temperatures are in degrees Celsius (°C).
Week of observations
Read the temperatures in order from Monday to Sunday.
Day
Temperature (°C)
Monday
18
Tuesday
19
Wednesday
17
Thursday
20
Friday
21
Saturday
22
Sunday
21
Read the pattern
Use evidence from the week’s record in each answer.
1.What makes this record time-series data?
- It compares temperatures in different towns at one moment.
- It records the same kind of measurement over a sequence of days.
- It lists people’s favourite weather.
- It gives temperatures with no time information.
2.Which day had the lowest recorded temperature, and what was it?
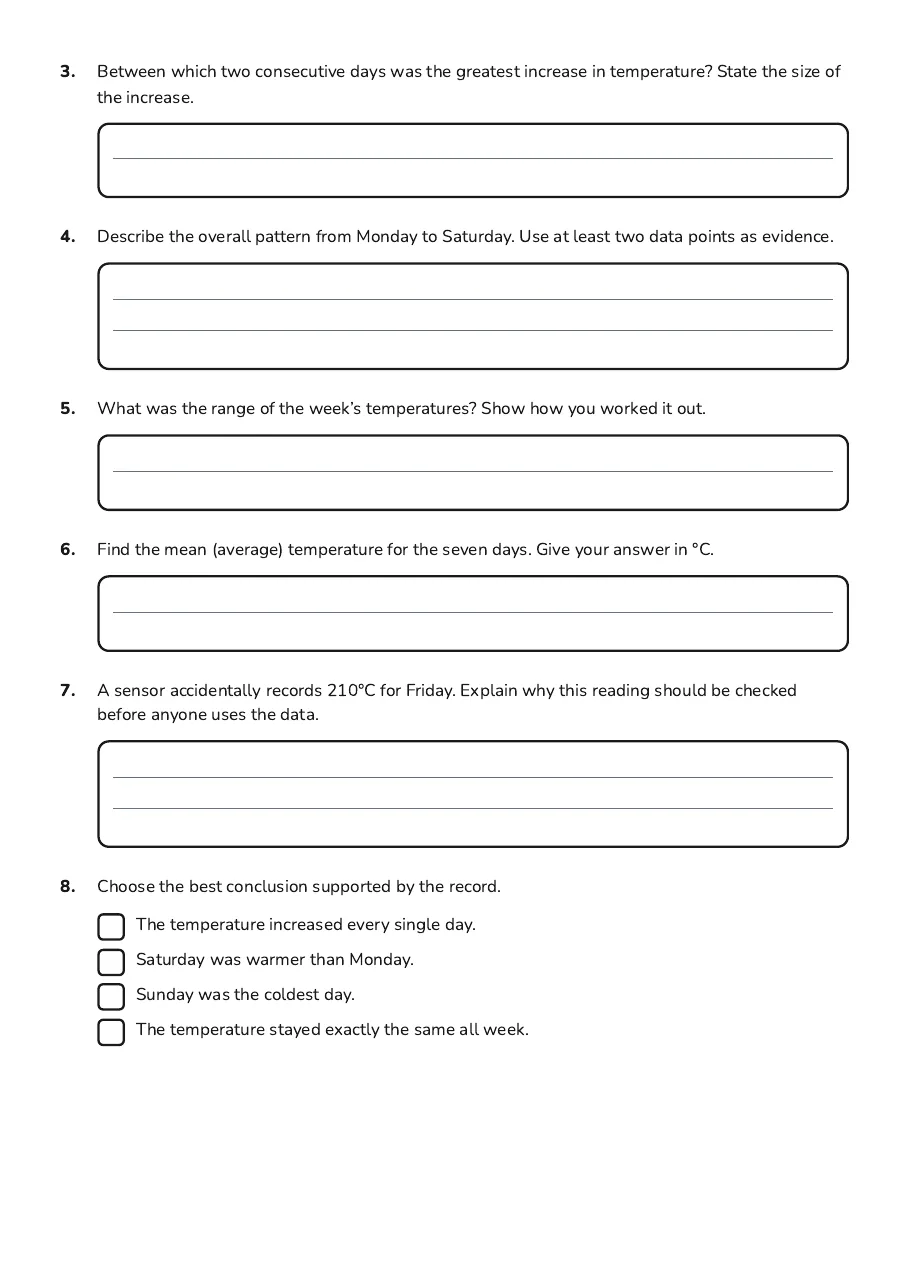
3.Between which two consecutive days was the greatest increase in temperature? State the size of the increase.
4.Describe the overall pattern from Monday to Saturday. Use at least two data points as evidence.
5.What was the range of the week’s temperatures? Show how you worked it out.
6.Find the mean (average) temperature for the seven days. Give your answer in °C.
7.A sensor accidentally records 210°C for Friday. Explain why this reading should be checked before anyone uses the data.
8.Choose the best conclusion supported by the record.
- The temperature increased every single day.
- Saturday was warmer than Monday.
- Sunday was the coldest day.
- The temperature stayed exactly the same all week.
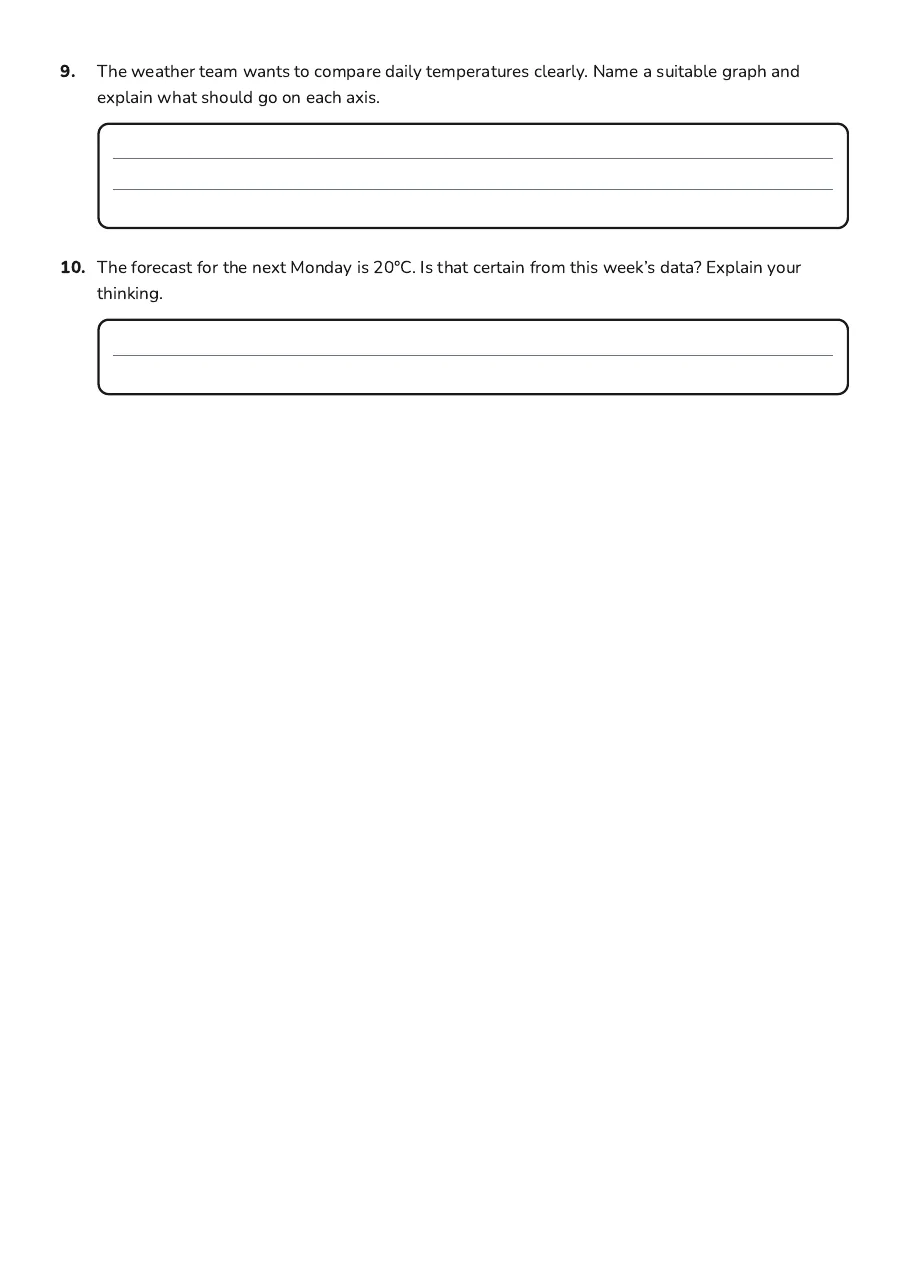
9.The weather team wants to compare daily temperatures clearly. Name a suitable graph and explain what should go on each axis.
10.The forecast for the next Monday is 20°C. Is that certain from this week’s data? Explain your thinking.
3 printable pages
Page 1
Page 2
Page 3
About This Worksheet
Free in Kuraplan
Sign up free, grab the PDF, and customize it for your class.
Print-Ready
Formatted for standard paper. Clean layout, easy to read.
AI-Generated
Created with Kuraplan's AI, designed for real classroom use.
For Teachers & Parents
Use in classrooms, for homework, tutoring, or homeschool.
Need a custom version of this worksheet?
Kuraplan's AI generates custom worksheets in seconds — differentiated for every learner, aligned to your curriculum.
Generate Custom Worksheets — Free No credit card Curriculum-aligned Under 60 seconds