MathsFreePrintable

Treaty Data Interpretation Worksheet

A free maths worksheet ready for your classroom. Open in Kuraplan to grab the print-ready PDF, customize it for your students, or generate a fresh version in seconds.
Treaty Data Interpretation Worksheet worksheet preview
Name:Date:

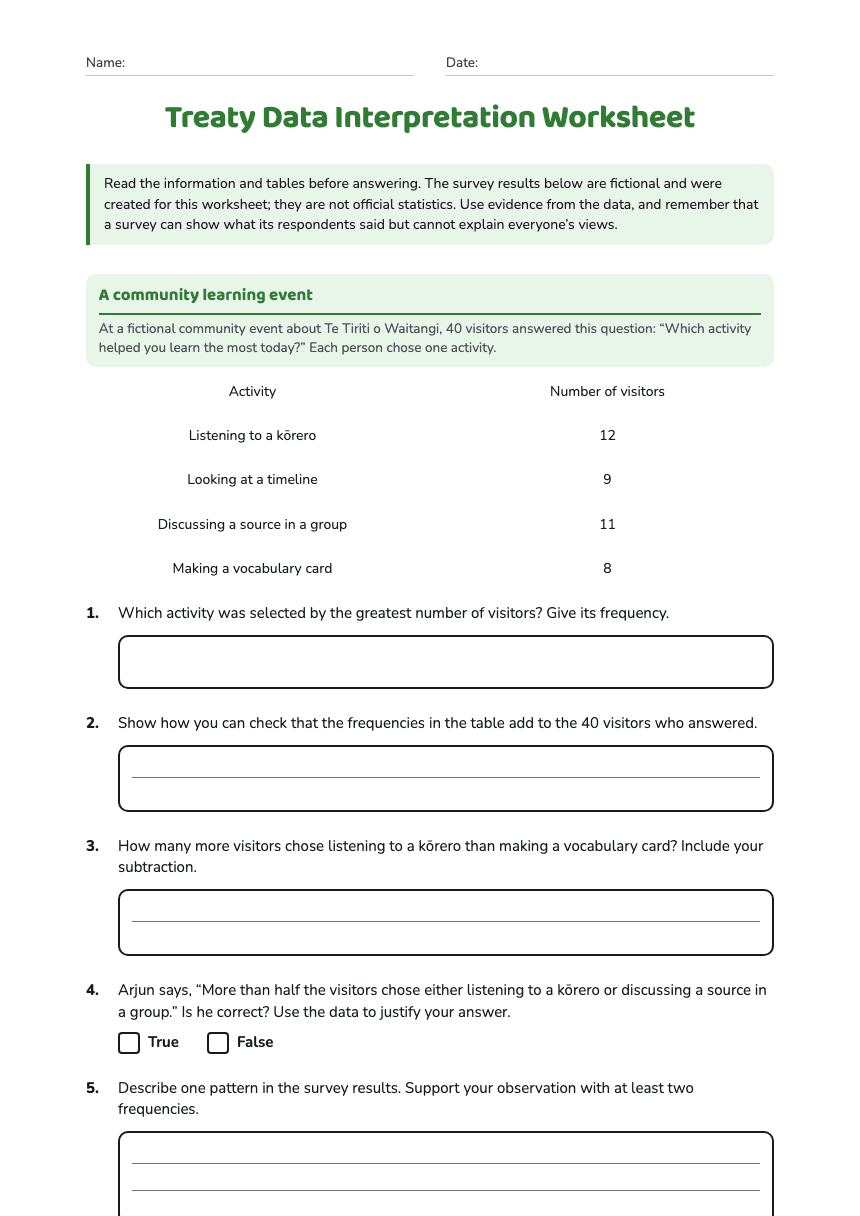
Treaty Data Interpretation Worksheet

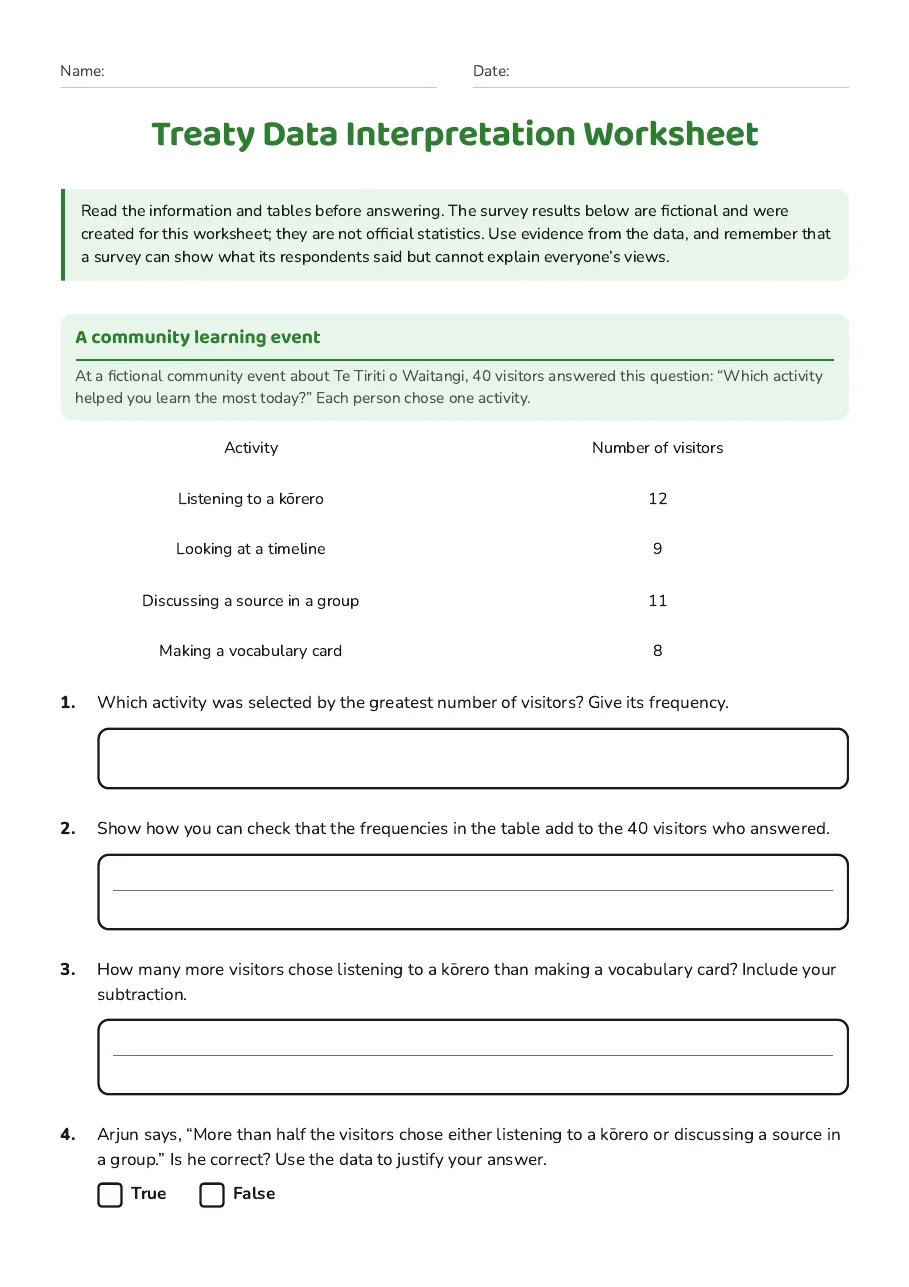
Read the information and tables before answering. The survey results below are fictional and were created for this worksheet; they are not official statistics. Use evidence from the data, and remember that a survey can show what its respondents said but cannot explain everyone’s views.

A community learning event

At a fictional community event about Te Tiriti o Waitangi, 40 visitors answered this question: “Which activity helped you learn the most today?” Each person chose one activity.

Activity

Number of visitors

Listening to a kōrero

12

Looking at a timeline

9

Discussing a source in a group

11

Making a vocabulary card

8

1.Which activity was selected by the greatest number of visitors? Give its frequency.
2.Show how you can check that the frequencies in the table add to the 40 visitors who answered.
3.How many more visitors chose listening to a kōrero than making a vocabulary card? Include your subtraction.
4.Arjun says, “More than half the visitors chose either listening to a kōrero or discussing a source in a group.” Is he correct? Use the data to justify your answer.
TrueFalse
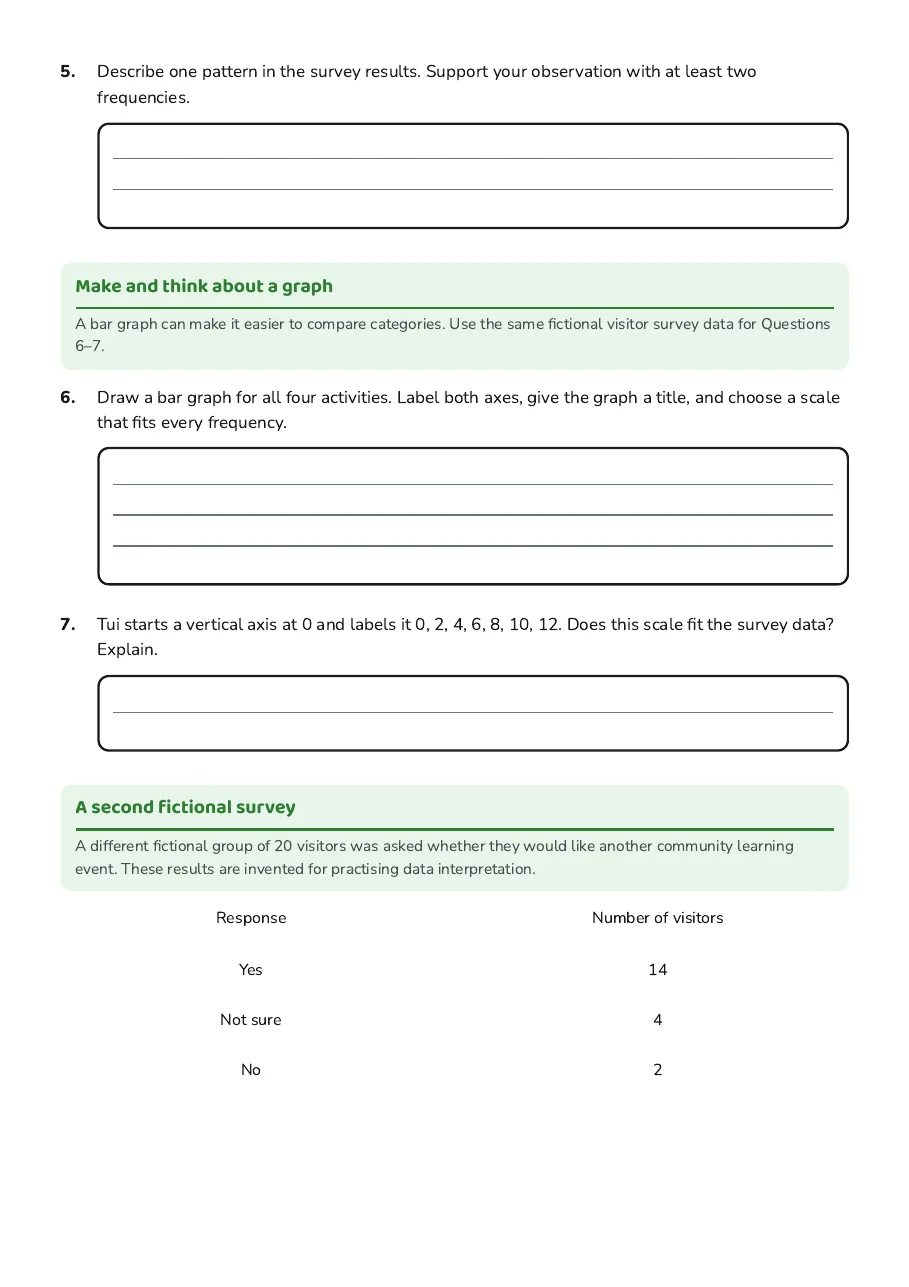
5.Describe one pattern in the survey results. Support your observation with at least two frequencies.

Make and think about a graph

A bar graph can make it easier to compare categories. Use the same fictional visitor survey data for Questions 6–7.

6.Draw a bar graph for all four activities. Label both axes, give the graph a title, and choose a scale that fits every frequency.
7.Tui starts a vertical axis at 0 and labels it 0, 2, 4, 6, 8, 10, 12. Does this scale fit the survey data? Explain.

A second fictional survey

A different fictional group of 20 visitors was asked whether they would like another community learning event. These results are invented for practising data interpretation.

Response

Number of visitors

Yes

14

Not sure

4

No

2

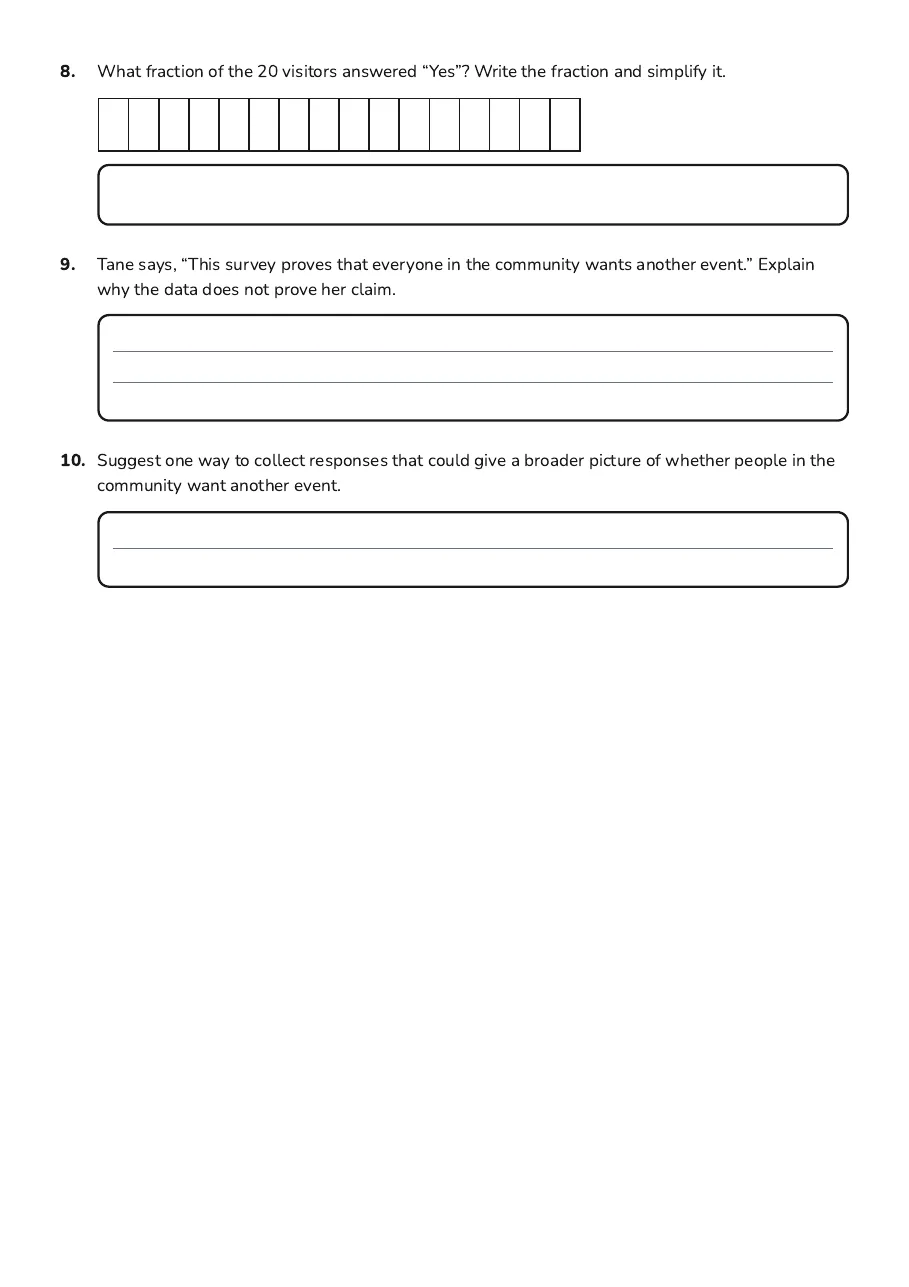
8.What fraction of the 20 visitors answered “Yes”? Write the fraction and simplify it.
9.Tane says, “This survey proves that everyone in the community wants another event.” Explain why the data does not prove her claim.
10.Suggest one way to collect responses that could give a broader picture of whether people in the community want another event.

3 printable pages

  • Treaty Data Interpretation Worksheet, page 1 of 3: A community learning event

    Page 1

  • Treaty Data Interpretation Worksheet, page 2 of 3: Make and think about a graph, A second fictional survey

    Page 2

  • Treaty Data Interpretation Worksheet, page 3 of 3: 8. What fraction of the 20 visitors answered “Yes”? Write the fraction and simplify it.

    Page 3

About This Worksheet

Free in Kuraplan

Sign up free, grab the PDF, and customize it for your class.

Print-Ready

Formatted for standard paper. Clean layout, easy to read.

AI-Generated

Created with Kuraplan's AI, designed for real classroom use.

For Teachers & Parents

Use in classrooms, for homework, tutoring, or homeschool.

Need a custom version of this worksheet?

Kuraplan's AI generates custom worksheets in seconds — differentiated for every learner, aligned to your curriculum.

Generate Custom Worksheets — Free
No credit card Curriculum-aligned Under 60 seconds