MathsFreePrintable
Statistical Sampling Investigation Worksheet
A free maths worksheet ready for your classroom. Open in Kuraplan to grab the print-ready PDF, customize it for your students, or generate a fresh version in seconds.
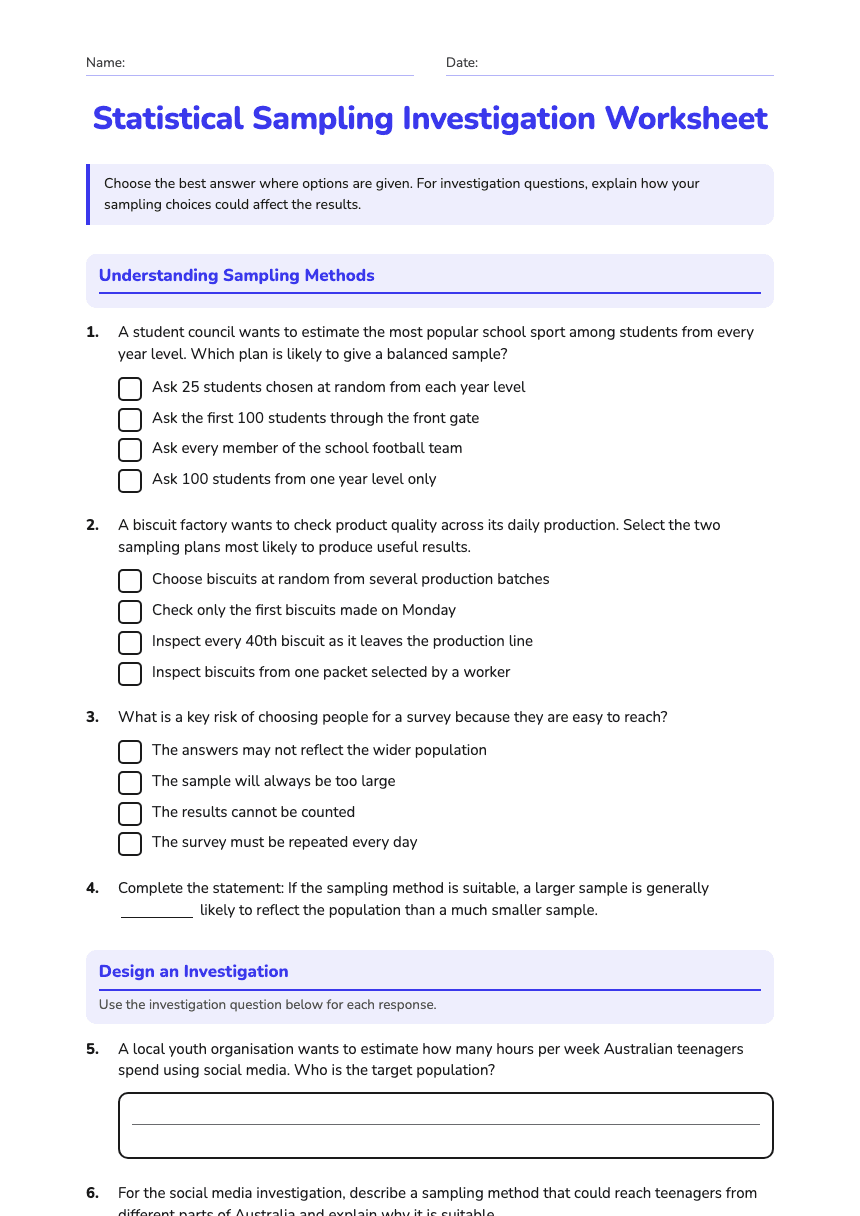
Name:Date:
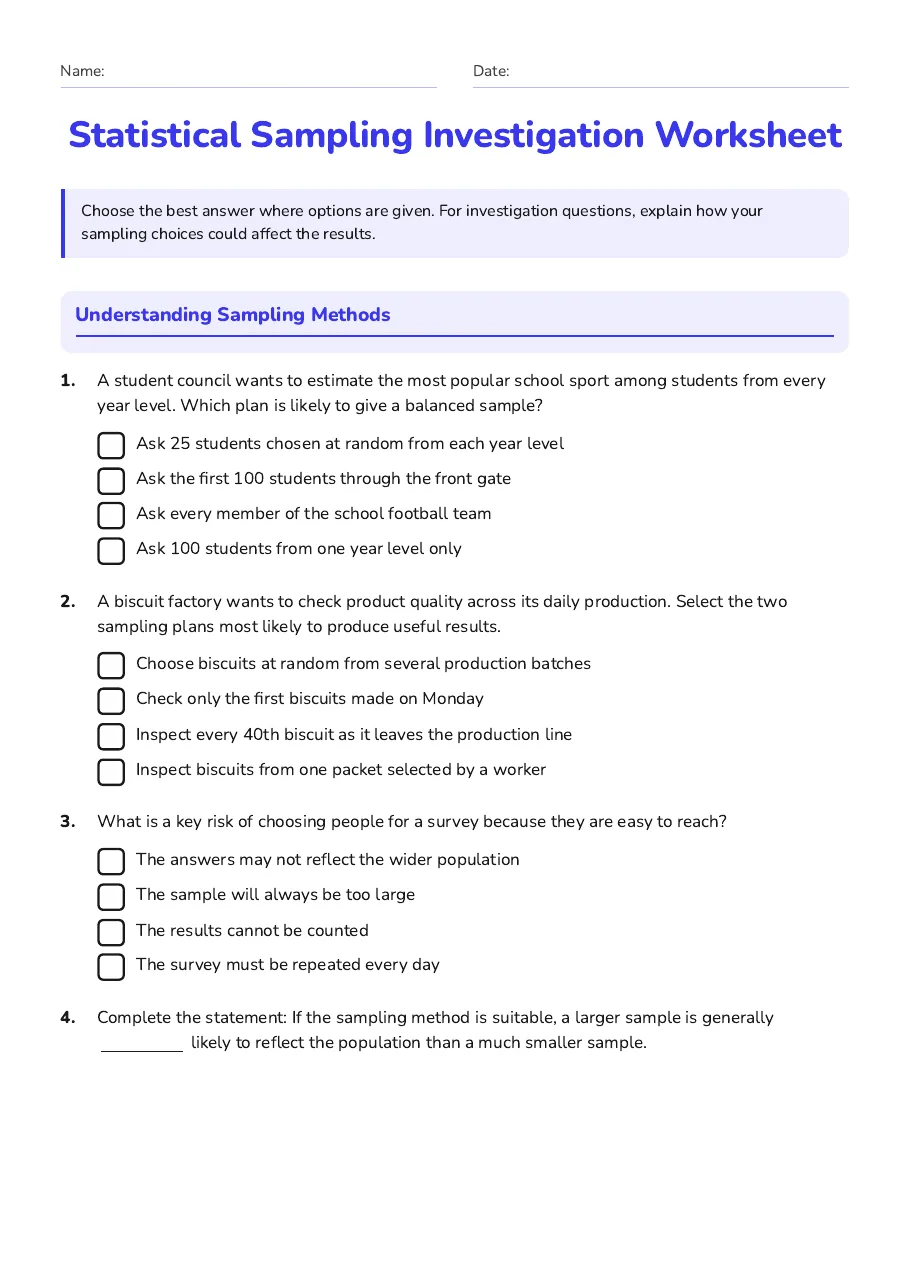
Statistical Sampling Investigation Worksheet
Choose the best answer where options are given. For investigation questions, explain how your sampling choices could affect the results.
Understanding Sampling Methods
1.A student council wants to estimate the most popular school sport among students from every year level. Which plan is likely to give a balanced sample?
- Ask 25 students chosen at random from each year level
- Ask the first 100 students through the front gate
- Ask every member of the school football team
- Ask 100 students from one year level only
2.A biscuit factory wants to check product quality across its daily production. Select the two sampling plans most likely to produce useful results.
- Choose biscuits at random from several production batches
- Check only the first biscuits made on Monday
- Inspect every 40th biscuit as it leaves the production line
- Inspect biscuits from one packet selected by a worker
3.What is a key risk of choosing people for a survey because they are easy to reach?
- The answers may not reflect the wider population
- The sample will always be too large
- The results cannot be counted
- The survey must be repeated every day
4.Complete the statement: If the sampling method is suitable, a larger sample is generally likely to reflect the population than a much smaller sample.
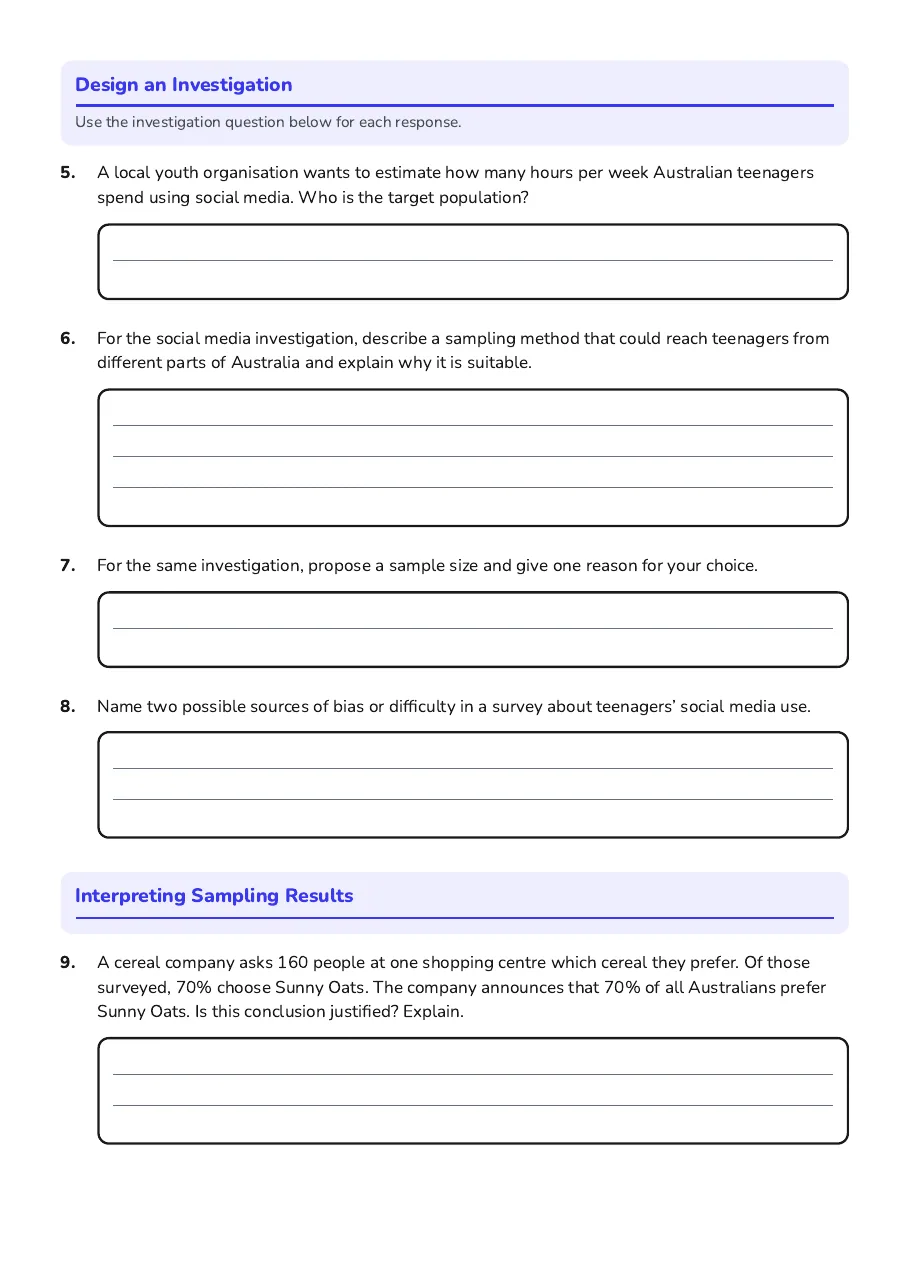
Design an Investigation
Use the investigation question below for each response.
5.A local youth organisation wants to estimate how many hours per week Australian teenagers spend using social media. Who is the target population?
6.For the social media investigation, describe a sampling method that could reach teenagers from different parts of Australia and explain why it is suitable.
7.For the same investigation, propose a sample size and give one reason for your choice.
8.Name two possible sources of bias or difficulty in a survey about teenagers’ social media use.
Interpreting Sampling Results
9.A cereal company asks 160 people at one shopping centre which cereal they prefer. Of those surveyed, 70% choose Sunny Oats. The company announces that 70% of all Australians prefer Sunny Oats. Is this conclusion justified? Explain.
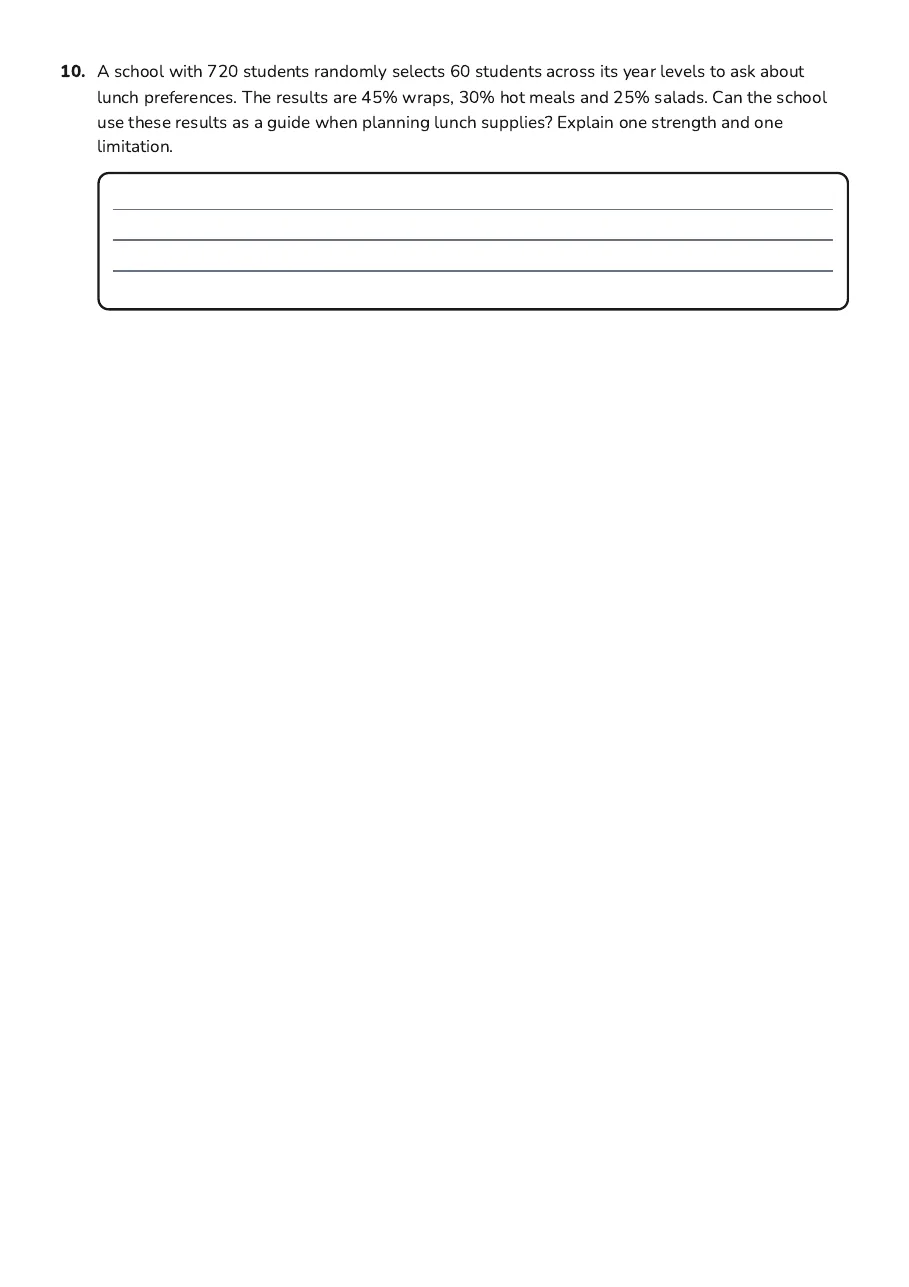
10.A school with 720 students randomly selects 60 students across its year levels to ask about lunch preferences. The results are 45% wraps, 30% hot meals and 25% salads. Can the school use these results as a guide when planning lunch supplies? Explain one strength and one limitation.
3 printable pages
Page 1
Page 2
Page 3
About This Worksheet
Free in Kuraplan
Sign up free, grab the PDF, and customize it for your class.
Print-Ready
Formatted for standard paper. Clean layout, easy to read.
AI-Generated
Created with Kuraplan's AI, designed for real classroom use.
For Teachers & Parents
Use in classrooms, for homework, tutoring, or homeschool.
Need a custom version of this worksheet?
Kuraplan's AI generates custom worksheets in seconds — differentiated for every learner, aligned to your curriculum.
Generate Custom Worksheets — Free No credit card Curriculum-aligned Under 60 seconds