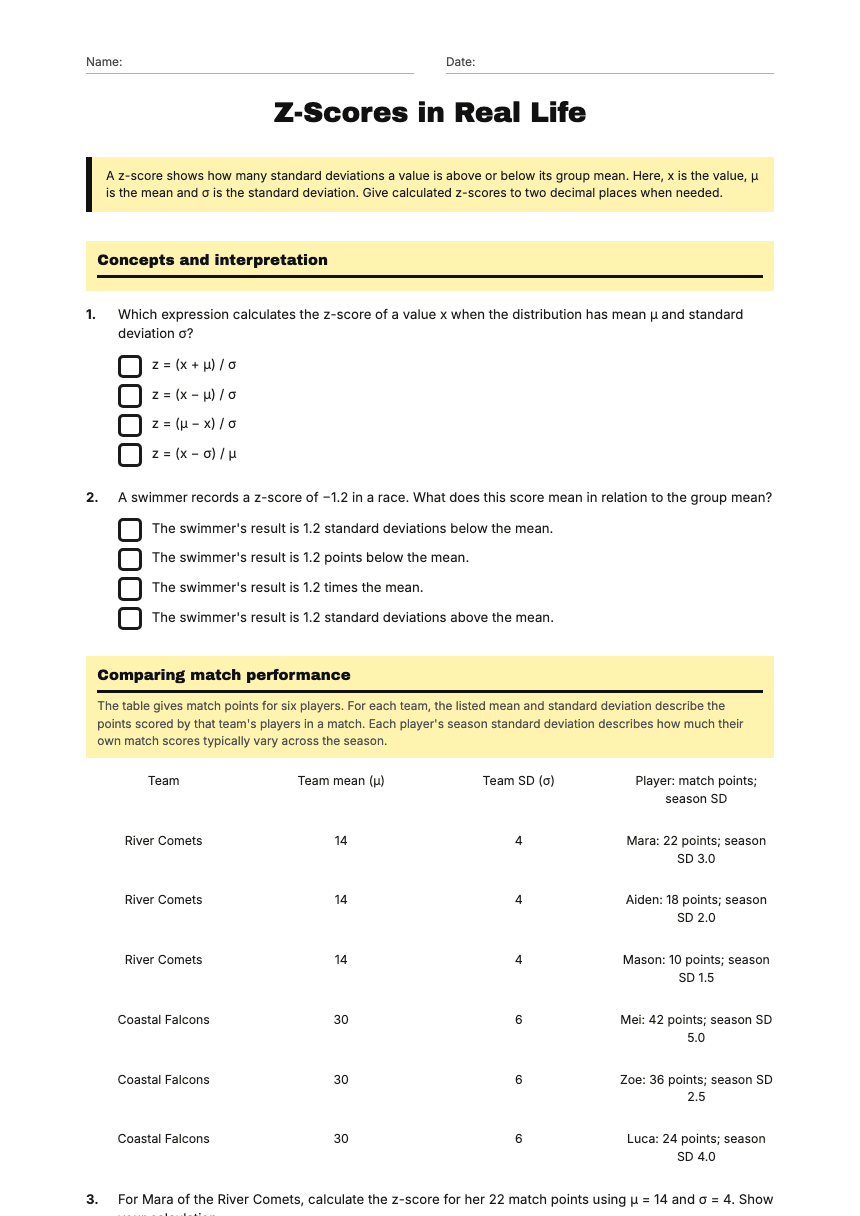
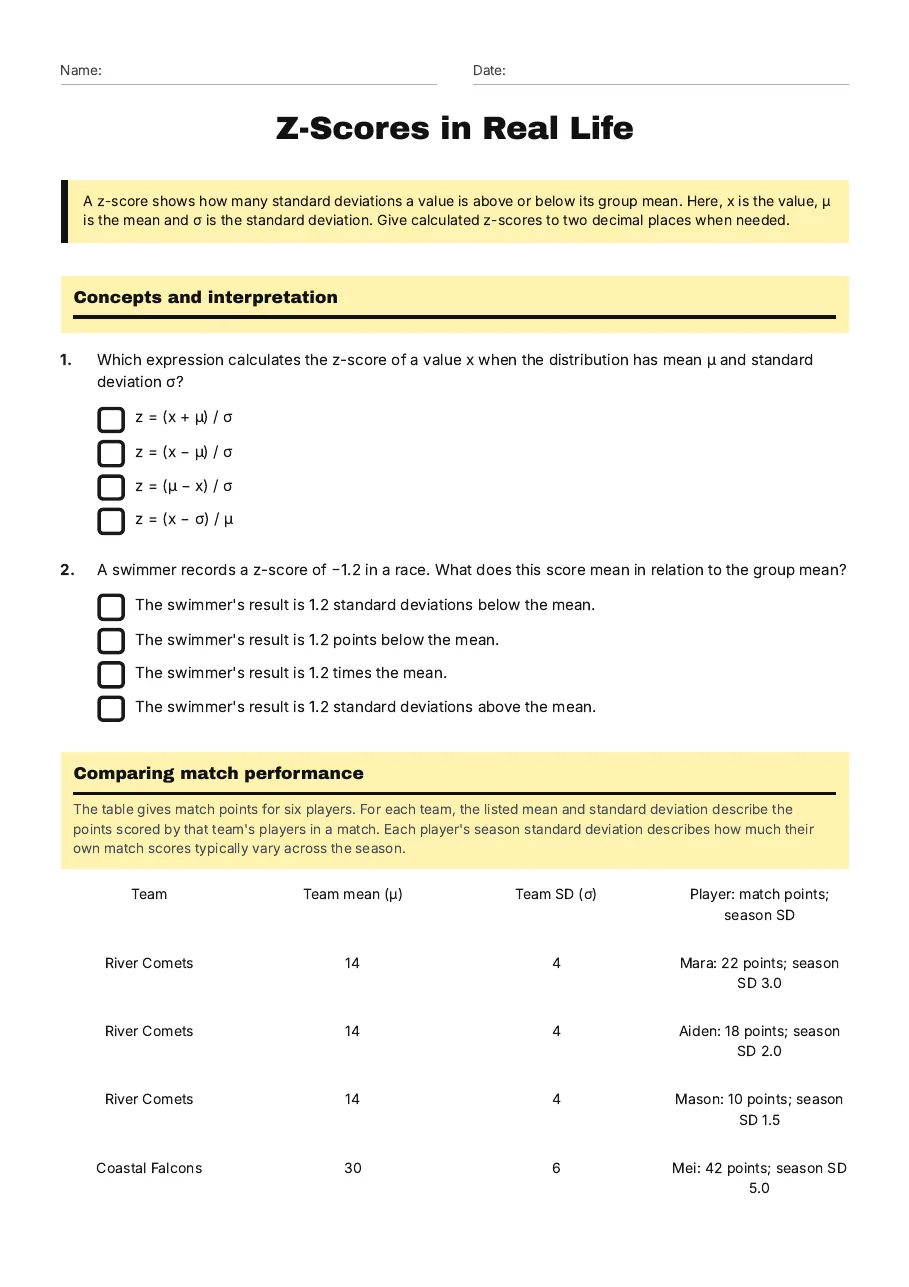
Z-Scores in Real Life
A free maths worksheet ready for your classroom. Open in Kuraplan to grab the print-ready PDF, customize it for your students, or generate a fresh version in seconds.
Z-Scores in Real Life
Concepts and interpretation
- z = (x + μ) / σ
- z = (x − μ) / σ
- z = (μ − x) / σ
- z = (x − σ) / μ
- The swimmer's result is 1.2 standard deviations below the mean.
- The swimmer's result is 1.2 points below the mean.
- The swimmer's result is 1.2 times the mean.
- The swimmer's result is 1.2 standard deviations above the mean.
Comparing match performance
The table gives match points for six players. For each team, the listed mean and standard deviation describe the points scored by that team's players in a match. Each player's season standard deviation describes how much their own match scores typically vary across the season.
Team
Team mean (μ)
Team SD (σ)
Player: match points; season SD
River Comets
14
4
Mara: 22 points; season SD 3.0
River Comets
14
4
Aiden: 18 points; season SD 2.0
River Comets
14
4
Mason: 10 points; season SD 1.5
Coastal Falcons
30
6
Mei: 42 points; season SD 5.0
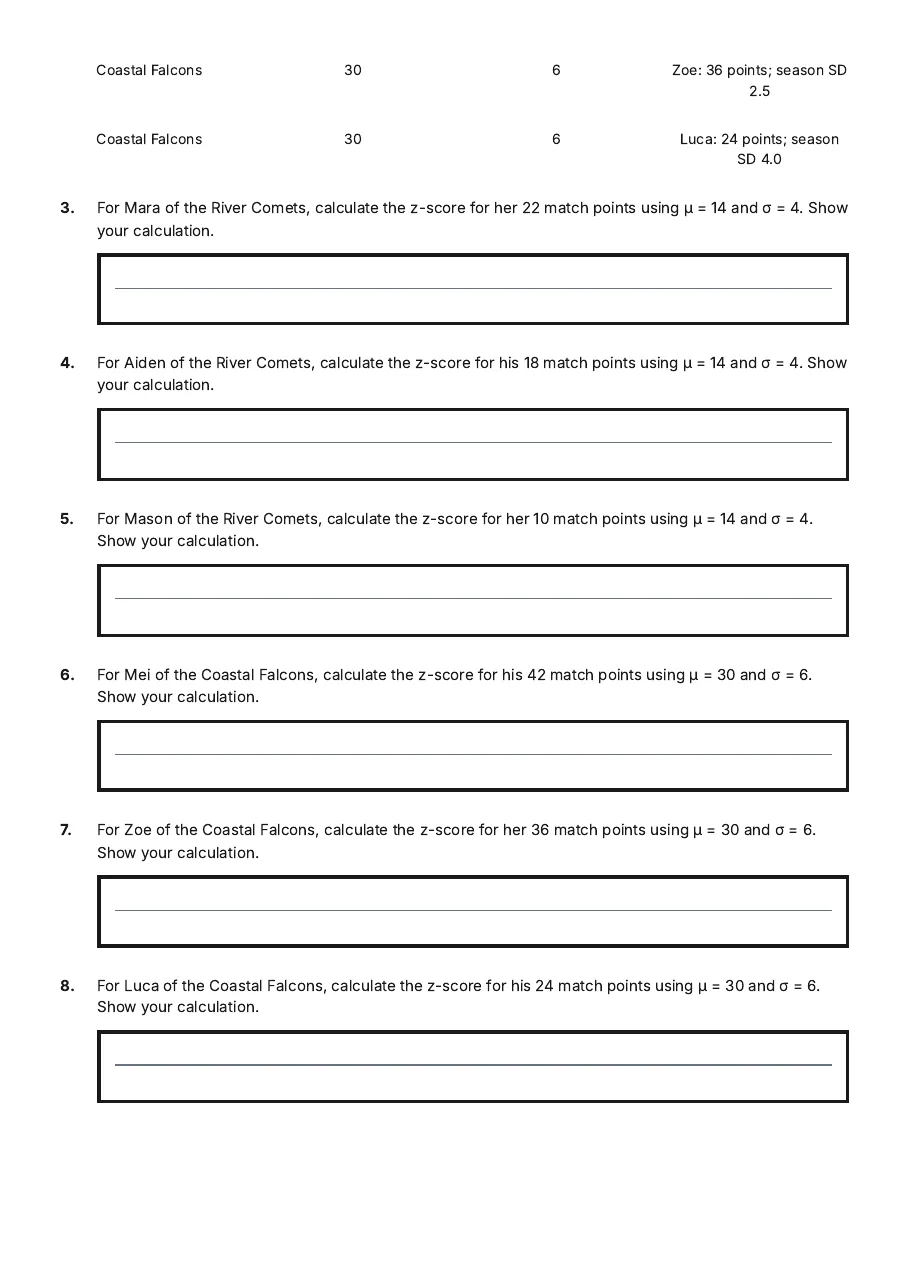
Coastal Falcons
30
6
Zoe: 36 points; season SD 2.5
Coastal Falcons
30
6
Luca: 24 points; season SD 4.0
3 printable pages
Page 1
Page 2
Page 3
About This Worksheet
Free in Kuraplan
Sign up free, grab the PDF, and customize it for your class.
Print-Ready
Formatted for standard paper. Clean layout, easy to read.
AI-Generated
Created with Kuraplan's AI, designed for real classroom use.
For Teachers & Parents
Use in classrooms, for homework, tutoring, or homeschool.
Need a custom version of this worksheet?
Kuraplan's AI generates custom worksheets in seconds — differentiated for every learner, aligned to your curriculum.
Generate Custom Worksheets — Free