Sound Wave Diagram — free printable diagram
Free science resource for teachers · CC BY-NC 4.0
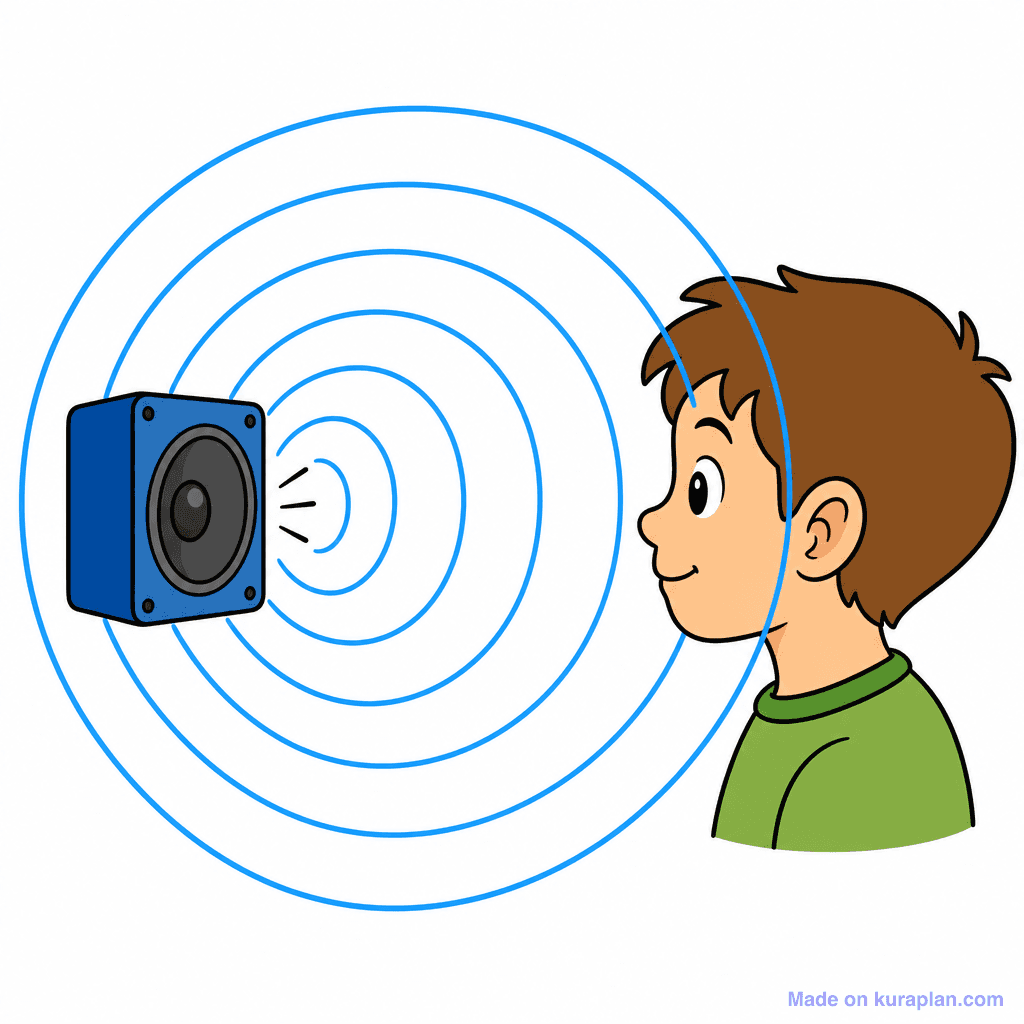
About this illustration
This flat, cartoon-style illustration depicts a blue rectangular speaker on the left, emitting sound waves shown as concentric blue circles. On the right, a young boy with brown hair and a green shirt is shown in profile, facing the speaker, indicating he is hearing the sound. The blue concentric circles visually represent the propagation of sound waves from the source. This image effectively teaches the science concept of how sound travels through waves and is perceived by the ear, suitable for K-5 science lessons on senses or basic physics. It can be used on slides to introduce the topic, as part of a worksheet explaining sound, or for a label exercise on sound sources and receivers.
What a sound wave diagram shows
Sound is made by something vibrating, and it travels as a wave through a material — a gas, a liquid or a solid. A sound wave diagram shows that wave in one of two standard ways: as rings spreading outwards from the source, or as a trace whose height and spacing stand for how loud and how high the sound is. Both are pictures of the same thing: a vibration being passed from particle to particle.
- What makes a sound
- A vibrating object
- How it travels
- As a wave through a solid, liquid or gas
- Type of wave
- Longitudinal — compressions and rarefactions
- Amplitude
- How loud the sound is
- Frequency
- How high or low the pitch is, measured in hertz (Hz)
- Speed in air
- About 340 metres per second
- Cannot travel through
- A vacuum — sound needs a medium
- A sound wave is longitudinal: the particles vibrate back and forth along the same direction the wave travels, squeezing together into compressions and spreading apart into rarefactions. Water waves and light are transverse instead, vibrating across the direction of travel.
- The particles themselves do not travel with the wave. Each one nudges its neighbour and returns, so the energy moves across the room while the air stays where it is — the single most useful point to draw out from the diagram.
- Amplitude is loudness. A bigger vibration shifts the particles further, is drawn as a taller trace, and is heard as a louder sound.
- Frequency is pitch. More vibrations per second means a higher note, drawn as waves packed closer together. Frequency is measured in hertz, one hertz being one vibration per second.
- Because sound needs particles to pass the vibration along, there is no sound in space. A bell ringing inside a jar gets quieter as the air is pumped out, which is the classic demonstration.
- Sound travels faster through liquids than gases, and faster again through solids, because the particles are closer together and pass the vibration on sooner.
How to use
- 1Right-click the image and choose “Save image as”, or use the download button.
- 2Use it in your classroom worksheets, slides or printables — free under CC BY-NC 4.0.
- 3Attribute as “Image by Kuraplan” or link back to kuraplan.com. Not for commercial resale.
Turn this image into a worksheet
This illustration is already in Kuraplan's editor — describe the worksheet you need and the AI builds it around the image in seconds.
Related illustrations
More from Forces, Light, Sound, Electricity


Free worksheets on Sound Wave Diagram
All free worksheetsBrowse by subject
21 subjects · 4,853 free illustrations
Maths
1,894 free illustrations
Cross-Curricular
835 free illustrations
English
612 free illustrations
Geography
549 free illustrations
Health
200 free illustrations
Social Studies
177 free illustrations
Religious Education
139 free illustrations
Music
128 free illustrations
Art
66 free illustrations
Drama
56 free illustrations
Social Sciences
48 free illustrations
History
47 free illustrations
Arts
26 free illustrations
PE
25 free illustrations
Te Reo Māori
24 free illustrations
Technology
16 free illustrations
Culture
7 free illustrations
Business
1 free illustrations
English
1 free illustrations
English (ELA)
1 free illustrations
Languages
1 free illustrations