Synoptic Chart Uk — free printable diagram
Free geography resource for teachers · CC BY-NC 4.0
About this illustration
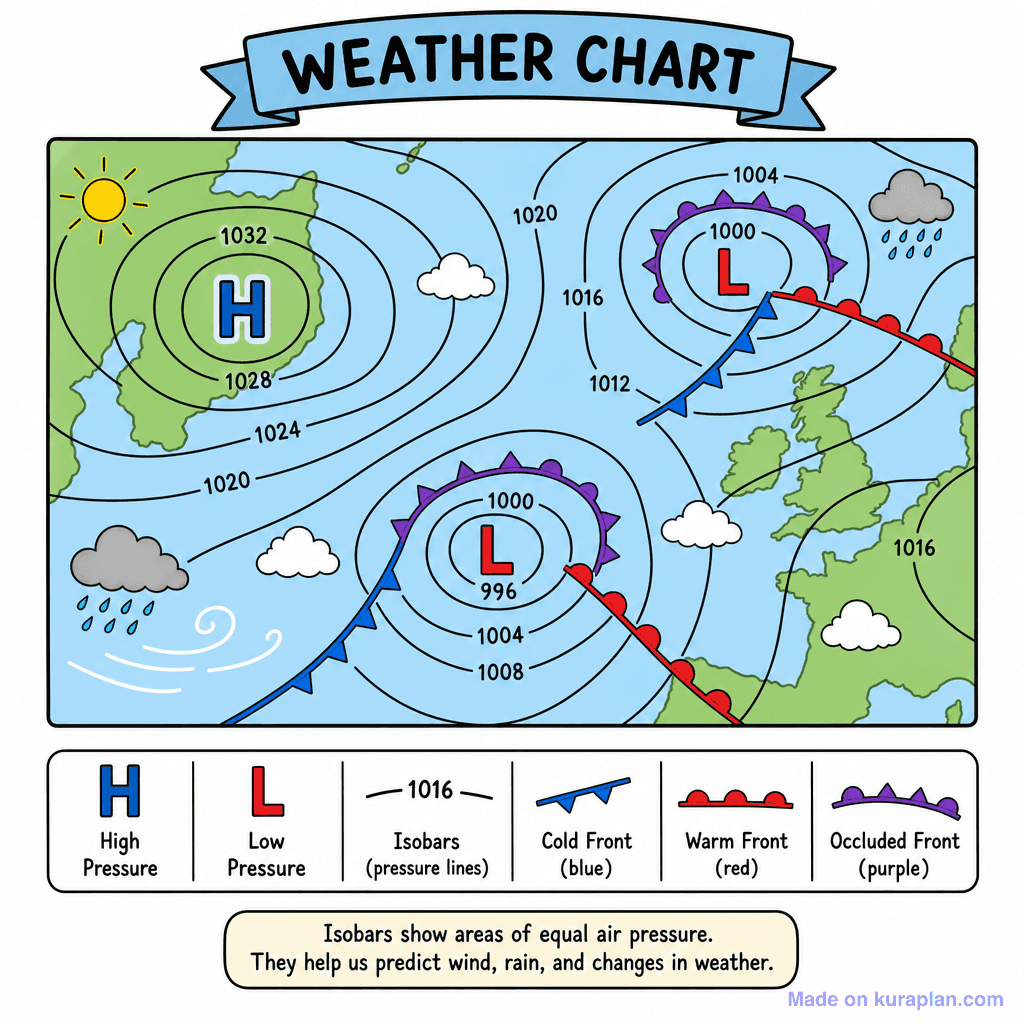
This flat illustration depicts a detailed weather chart, featuring a simplified map of Western Europe and the North Atlantic region. It clearly illustrates high (H) and low (L) pressure systems using isobar lines, alongside various weather fronts including cold (blue triangles), warm (red semicircles), and occluded (purple triangles and semicircles) fronts. The image also incorporates common weather symbols for sun, clouds, and rain, all defined in a comprehensive legend at the bottom. An explanatory text box clarifies the role of isobars in weather prediction. This resource is excellent for teaching basic meteorology concepts, weather map interpretation, and atmospheric pressure, suitable for science or geography lessons, particularly within a UK or European-focused curriculum, and can be used effectively on slides or as part of a worksheet activity.
How to read a synoptic chart
A synoptic chart is a weather map showing conditions across a region at one moment. Two things carry most of the information: the isobars, which are lines joining places of equal air pressure, and the front symbols, which mark the boundaries between air masses. Read the pressure first and the fronts second, and the chart tells you what the weather is doing and which way it is heading.
- What it shows
- Air pressure, fronts and wind across a region at one moment
- Isobars
- Lines joining places of equal air pressure
- Pressure unit
- Millibars (mb), also written hectopascals (hPa)
- Low pressure (depression)
- Unsettled — cloud, rain, stronger winds
- High pressure (anticyclone)
- Settled — drier, lighter winds
- Closely spaced isobars
- Strong wind
- Front symbols
- Triangles for cold, semicircles for warm, both for occluded
- Isobars do for pressure what contour lines do for height: each line is one value, and how close together they run tells you how steeply the quantity changes.
- Isobar spacing is the wind-speed clue. Tightly packed isobars mean a steep pressure gradient and strong wind; widely spaced isobars mean light wind.
- Wind blows roughly along the isobars rather than straight across them. In the northern hemisphere it circulates anticlockwise around a low and clockwise around a high; in the southern hemisphere both are reversed.
- A depression brings rising air, cloud and rain. An anticyclone brings sinking air, which suppresses cloud — giving clear settled spells, hot and dry in summer and frosty or foggy in winter.
- The symbols point the way a front is moving: triangles on a cold front, semicircles on a warm front, and the two alternating on an occluded front, where a cold front has caught up with the warm front ahead of it.
- A good reading order for students: find the centres of low and high pressure, check the isobar spacing for wind strength, then locate the fronts and work out which places they will cross next.
How to use
- 1Right-click the image and choose “Save image as”, or use the download button.
- 2Use it in your classroom worksheets, slides or printables — free under CC BY-NC 4.0.
- 3Attribute as “Image by Kuraplan” or link back to kuraplan.com. Not for commercial resale.
Turn this image into a worksheet
This illustration is already in Kuraplan's editor — describe the worksheet you need and the AI builds it around the image in seconds.
Related illustrations
More from Weather & Climate

Free worksheets on Synoptic Chart Uk
All free worksheetsBrowse by subject
21 subjects · 5,118 free illustrations
Maths
1,894 free illustrations
Cross-Curricular
835 free illustrations
Science
814 free illustrations
English
612 free illustrations
Health
200 free illustrations
Social Studies
177 free illustrations
Religious Education
139 free illustrations
Music
128 free illustrations
Art
66 free illustrations
Drama
56 free illustrations
Social Sciences
48 free illustrations
History
47 free illustrations
Arts
26 free illustrations
PE
25 free illustrations
Te Reo Māori
24 free illustrations
Technology
16 free illustrations
Culture
7 free illustrations
Business
1 free illustrations
English
1 free illustrations
English (ELA)
1 free illustrations
Languages
1 free illustrations