Time Conversion Chart (simple) — free printable clipart
Free maths resource for teachers · CC BY-NC 4.0
About this illustration
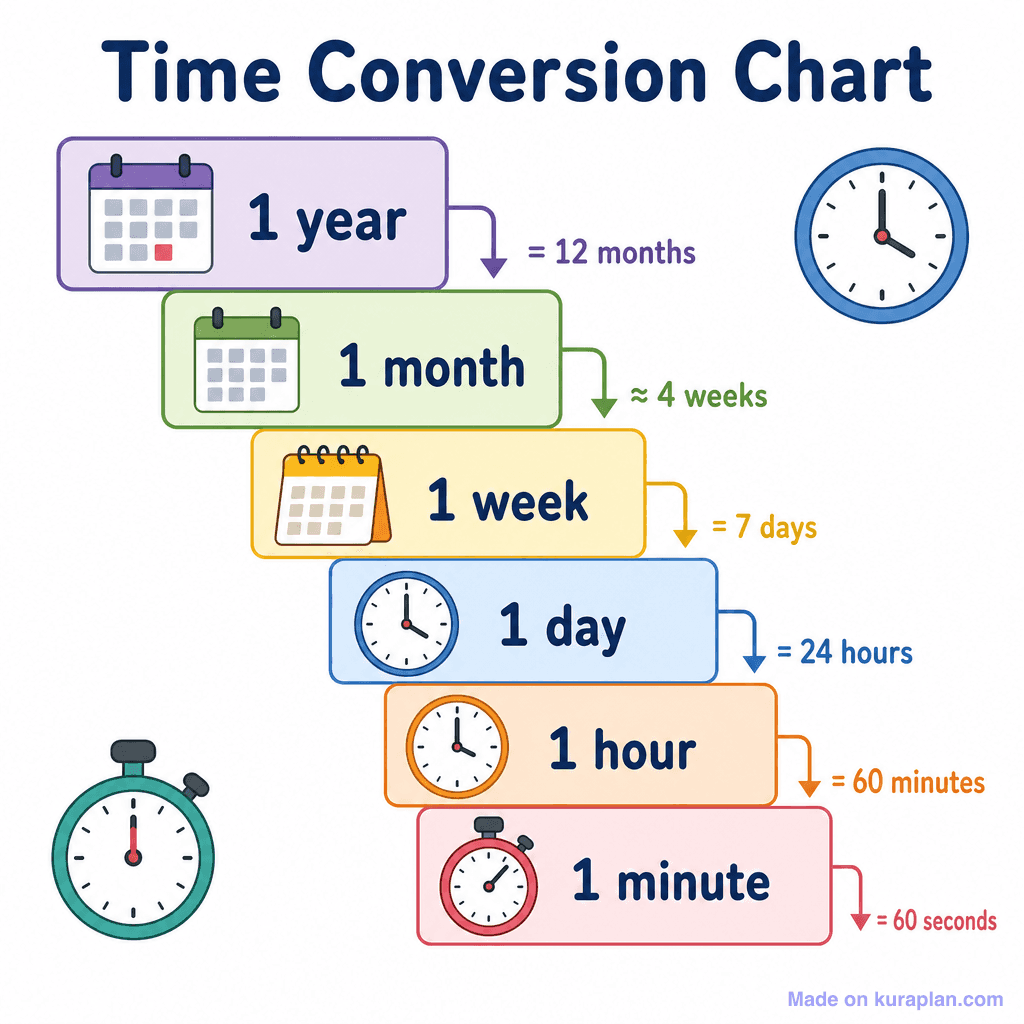
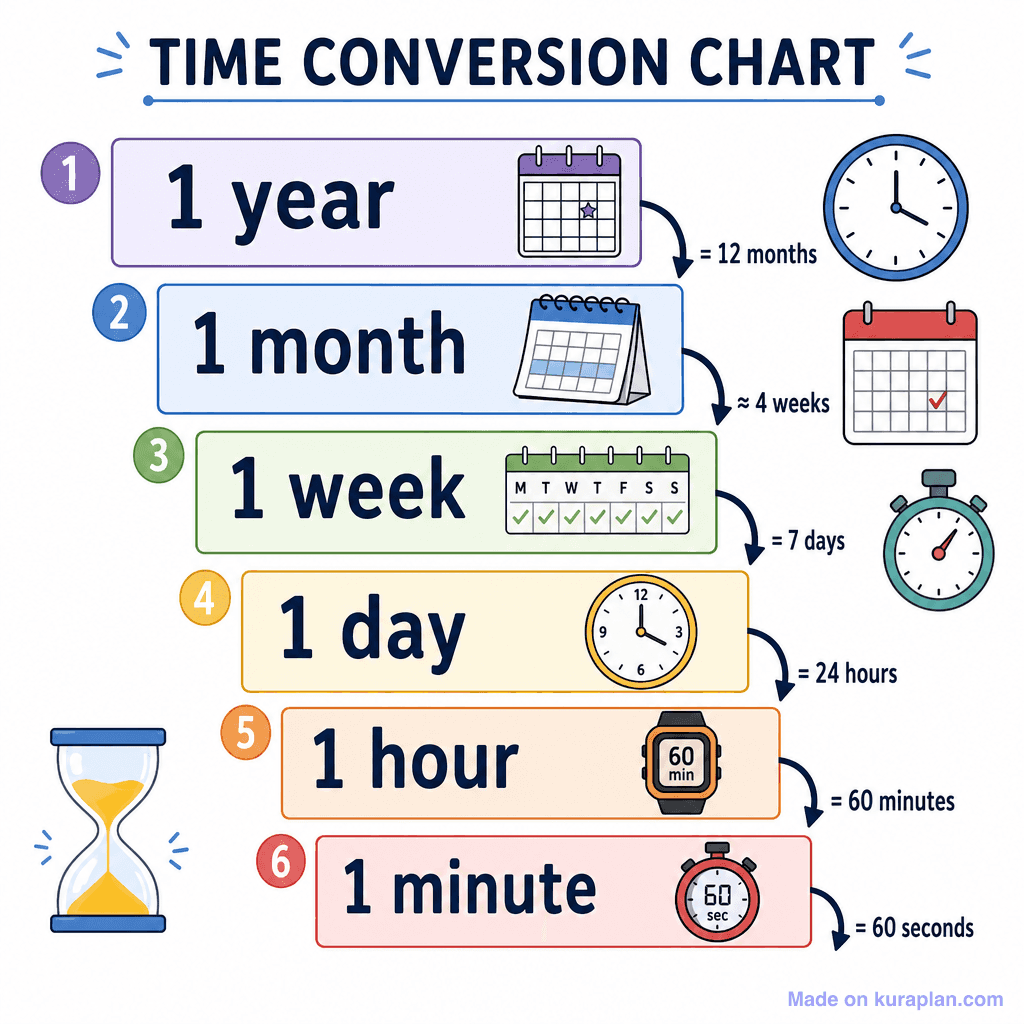
A colourful stepped cascade chart titled 'Time Conversion Chart' showing six time units from largest to smallest (year, month, week, day, hour, minute), each in a colour-coded box with an icon (calendar or clock/stopwatch) and an arrow pointing to its equivalent value in the next smaller unit. Decorative clock and stopwatch icons appear in the corners.
How to use
- 1Right-click the image and choose “Save image as”, or use the download button.
- 2Use it in your classroom worksheets, slides or printables — free under CC BY-NC 4.0.
- 3Attribute as “Image by Kuraplan” or link back to kuraplan.com. Not for commercial resale.
Turn this image into a worksheet
This illustration is already in Kuraplan's editor — describe the worksheet you need and the AI builds it around the image in seconds.
Related illustrations
More free maths illustrations
Free worksheets on Time Conversion Chart (simple)
All free worksheetsBrowse by subject
18 subjects · 3,771 free illustrations
Cross-Curricular
835 free illustrations
Science
815 free illustrations
English
612 free illustrations
Geography
549 free illustrations
Health
200 free illustrations
Social Studies
177 free illustrations
Religious Education
139 free illustrations
Music
128 free illustrations
Art
66 free illustrations
Drama
56 free illustrations
Social Sciences
48 free illustrations
History
47 free illustrations
Arts
26 free illustrations
PE
25 free illustrations
Te Reo Māori
24 free illustrations
Technology
16 free illustrations
Culture
7 free illustrations
Languages
1 free illustrations