Bivariate Time-Series Graphs
A free maths worksheet ready for your classroom. Open in Kuraplan to grab the print-ready PDF, customize it for your students, or generate a fresh version in seconds.
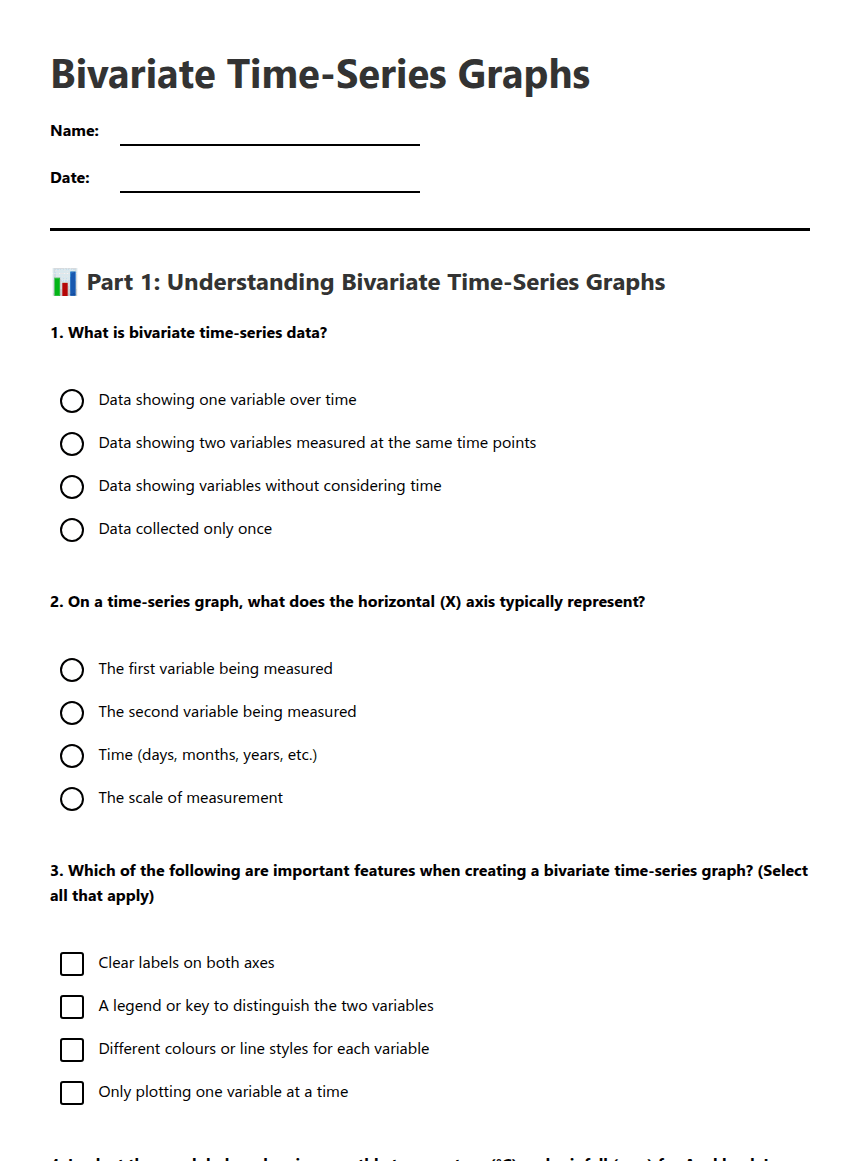
Bivariate Time-Series Graphs
📊 Part 1: Understanding Bivariate Time-Series Graphs
Note: Imagine a graph where temperature peaks in January at 24°C and rainfall is lowest in February at 15mm.
📈 Part 2: Interpreting Bivariate Time-Series Data
Use the following scenario for questions 5-8:
A Year 7 student tracked their daily steps and hours of sleep over two weeks. The graph shows that steps ranged from 8,000 to 15,000 per day, while sleep ranged from 6 to 10 hours per night.
When both variables show an upward _____________ over time, we can say they have a positive _____________ during that period.
🎯 Part 3: Analysis and Critical Thinking
• The two variables you would measure: _________________ and _________________
• The time period: _________________________________
• One prediction about the relationship: ___________________________________________
About This Worksheet
Free in Kuraplan
Sign up free, grab the PDF, and customize it for your class.
Print-Ready
Formatted for standard paper. Clean layout, easy to read.
AI-Generated
Created with Kuraplan's AI, designed for real classroom use.
For Teachers & Parents
Use in classrooms, for homework, tutoring, or homeschool.
Need a custom version of this worksheet?
Kuraplan's AI generates custom worksheets in seconds — differentiated for every learner, aligned to your curriculum.
Generate Custom Worksheets — Free






