MathsFreePrintable

Data Collection and Graphs

A free maths worksheet ready for your classroom. Open in Kuraplan to grab the print-ready PDF, customize it for your students, or generate a fresh version in seconds.
Data Collection and Graphs worksheet preview
Name:Date:

Data Collection and Graphs

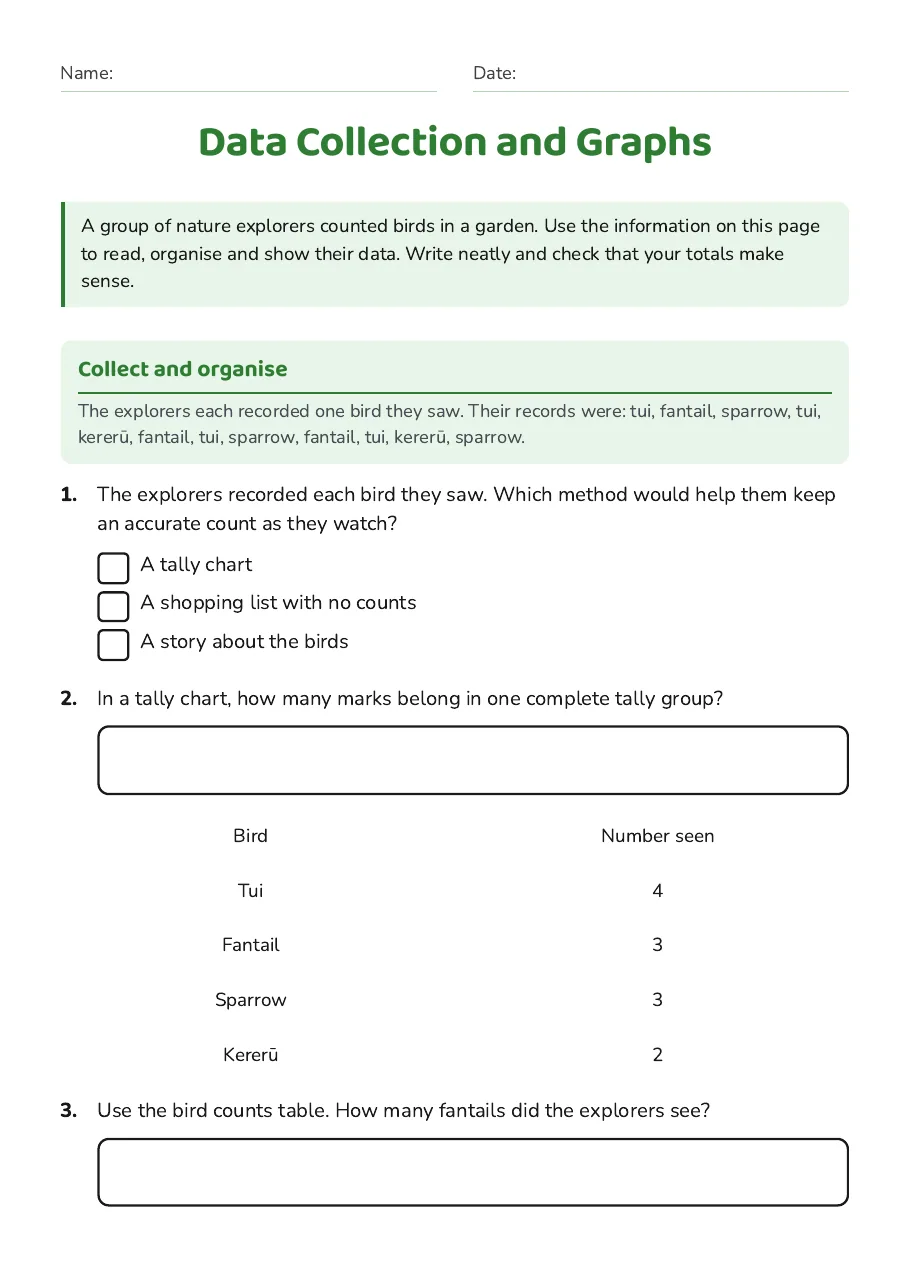
A group of nature explorers counted birds in a garden. Use the information on this page to read, organise and show their data. Write neatly and check that your totals make sense.

Collect and organise

The explorers each recorded one bird they saw. Their records were: tui, fantail, sparrow, tui, kererū, fantail, tui, sparrow, fantail, tui, kererū, sparrow.

1.The explorers recorded each bird they saw. Which method would help them keep an accurate count as they watch?
  • A tally chart
  • A shopping list with no counts
  • A story about the birds
2.In a tally chart, how many marks belong in one complete tally group?

Bird

Number seen

Tui

4

Fantail

3

Sparrow

3

Kererū

2

3.Use the bird counts table. How many fantails did the explorers see?
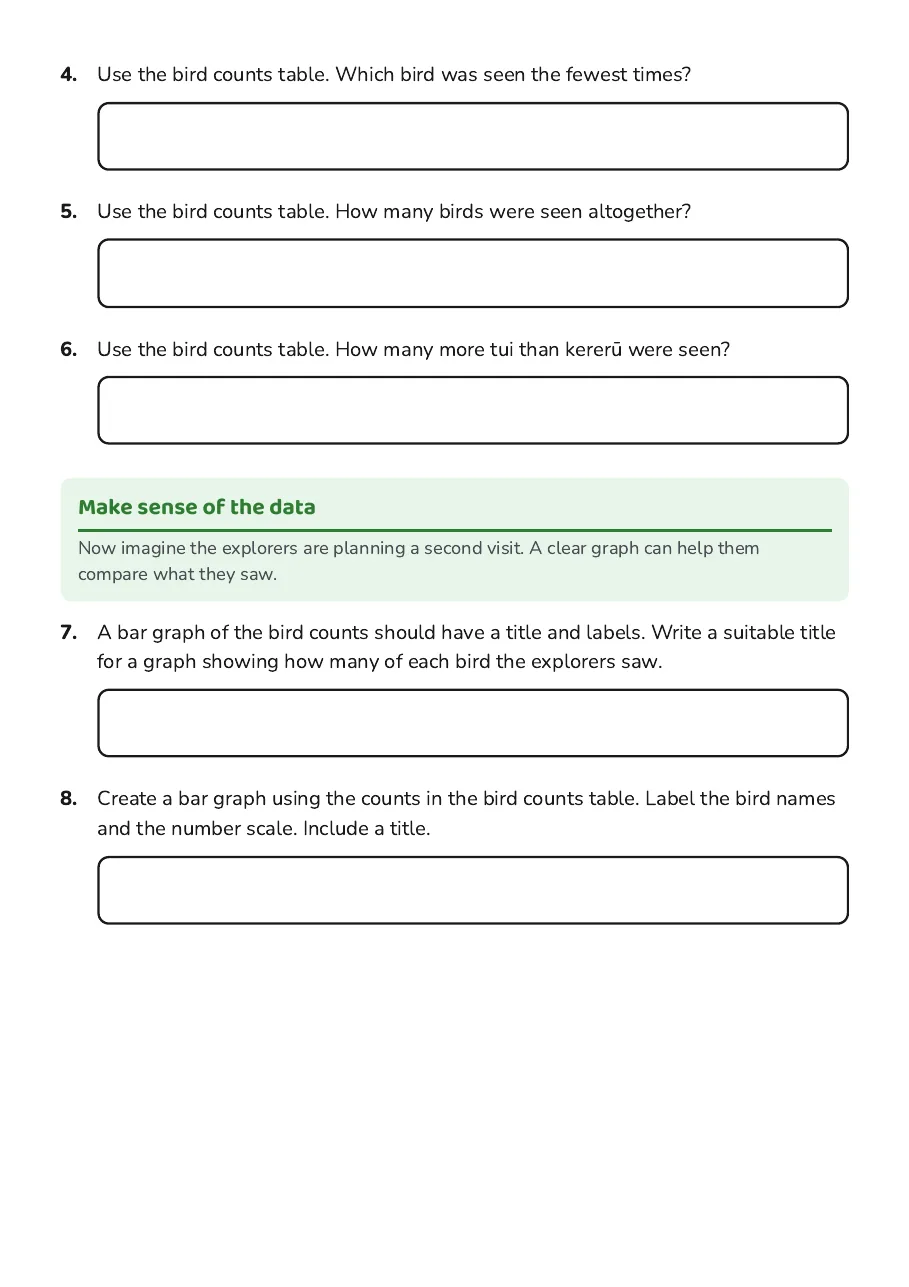
4.Use the bird counts table. Which bird was seen the fewest times?
5.Use the bird counts table. How many birds were seen altogether?
6.Use the bird counts table. How many more tui than kererū were seen?

Make sense of the data

Now imagine the explorers are planning a second visit. A clear graph can help them compare what they saw.

7.A bar graph of the bird counts should have a title and labels. Write a suitable title for a graph showing how many of each bird the explorers saw.
8.Create a bar graph using the counts in the bird counts table. Label the bird names and the number scale. Include a title.
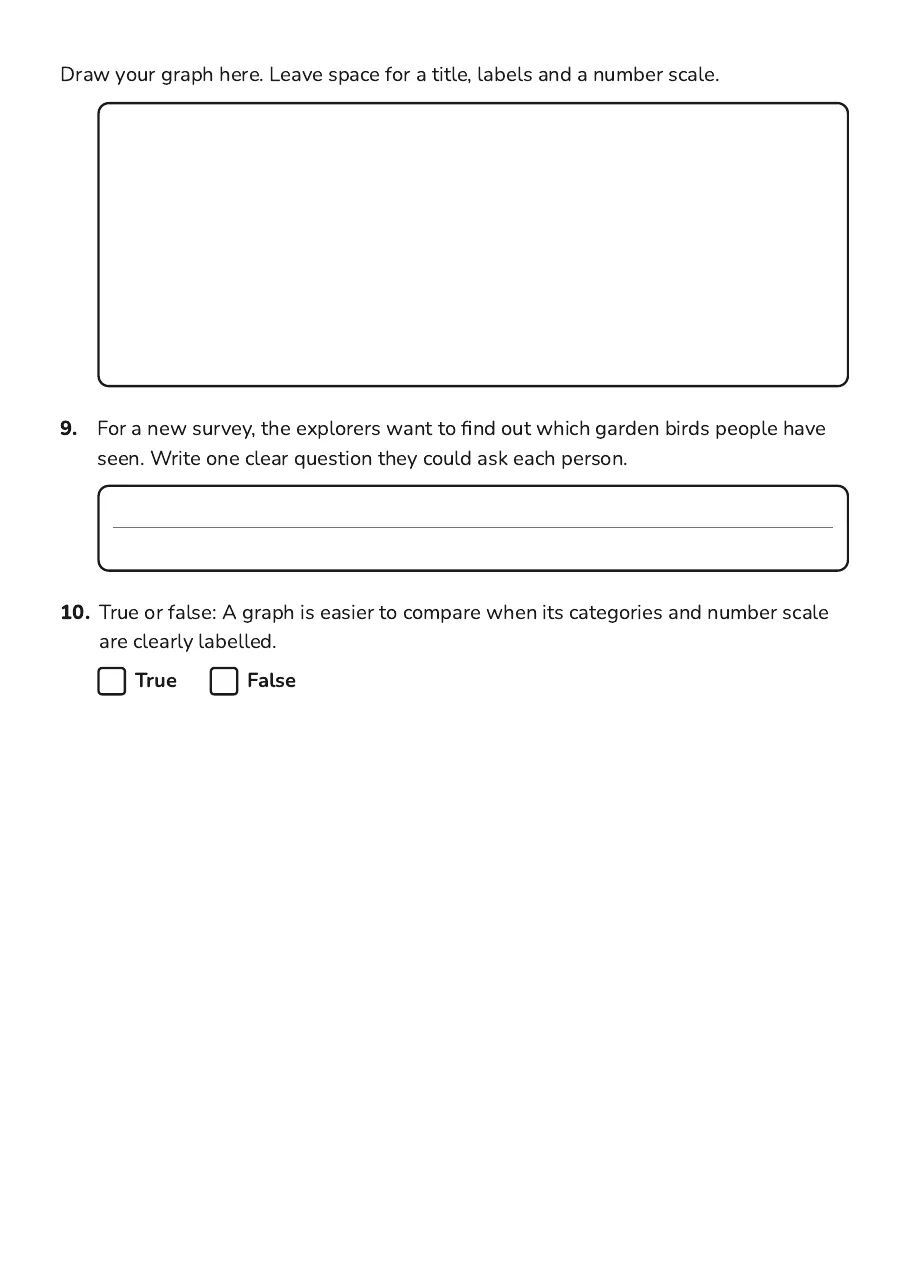
Draw your graph here. Leave space for a title, labels and a number scale.
9.For a new survey, the explorers want to find out which garden birds people have seen. Write one clear question they could ask each person.
10.True or false: A graph is easier to compare when its categories and number scale are clearly labelled.
TrueFalse

3 printable pages

  • Data Collection and Graphs, page 1 of 3: Collect and organise

    Page 1

  • Data Collection and Graphs, page 2 of 3: Make sense of the data

    Page 2

  • Data Collection and Graphs, page 3 of 3: Draw your graph here. Leave space for a title, labels and a number scale.

    Page 3

About This Worksheet

Free in Kuraplan

Sign up free, grab the PDF, and customize it for your class.

Print-Ready

Formatted for standard paper. Clean layout, easy to read.

AI-Generated

Created with Kuraplan's AI, designed for real classroom use.

For Teachers & Parents

Use in classrooms, for homework, tutoring, or homeschool.

Need a custom version of this worksheet?

Kuraplan's AI generates custom worksheets in seconds — differentiated for every learner, aligned to your curriculum.

Generate Custom Worksheets — Free
No credit card Curriculum-aligned Under 60 seconds