MathsFreePrintable

Data Collection Practice

A free maths worksheet ready for your classroom. Open in Kuraplan to grab the print-ready PDF, customize it for your students, or generate a fresh version in seconds.

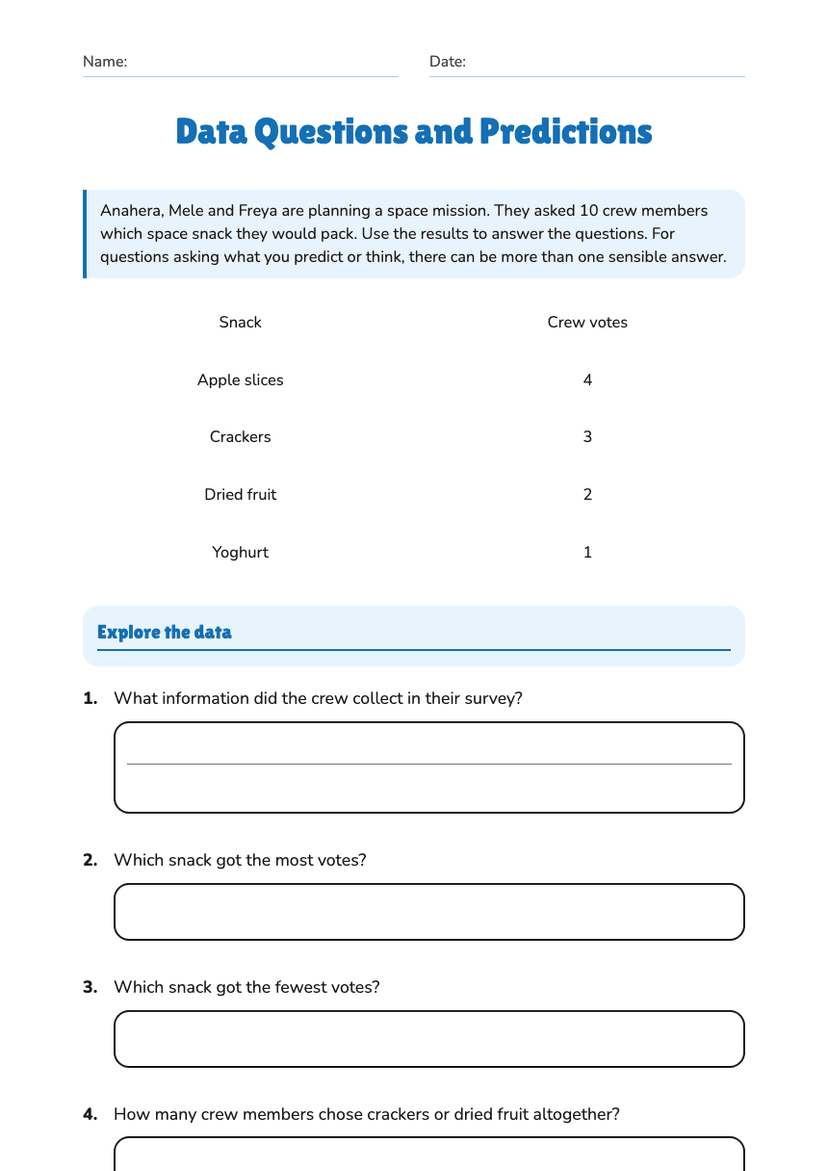
Data Collection Practice worksheet preview
Name:Date:

Data Collection Practice

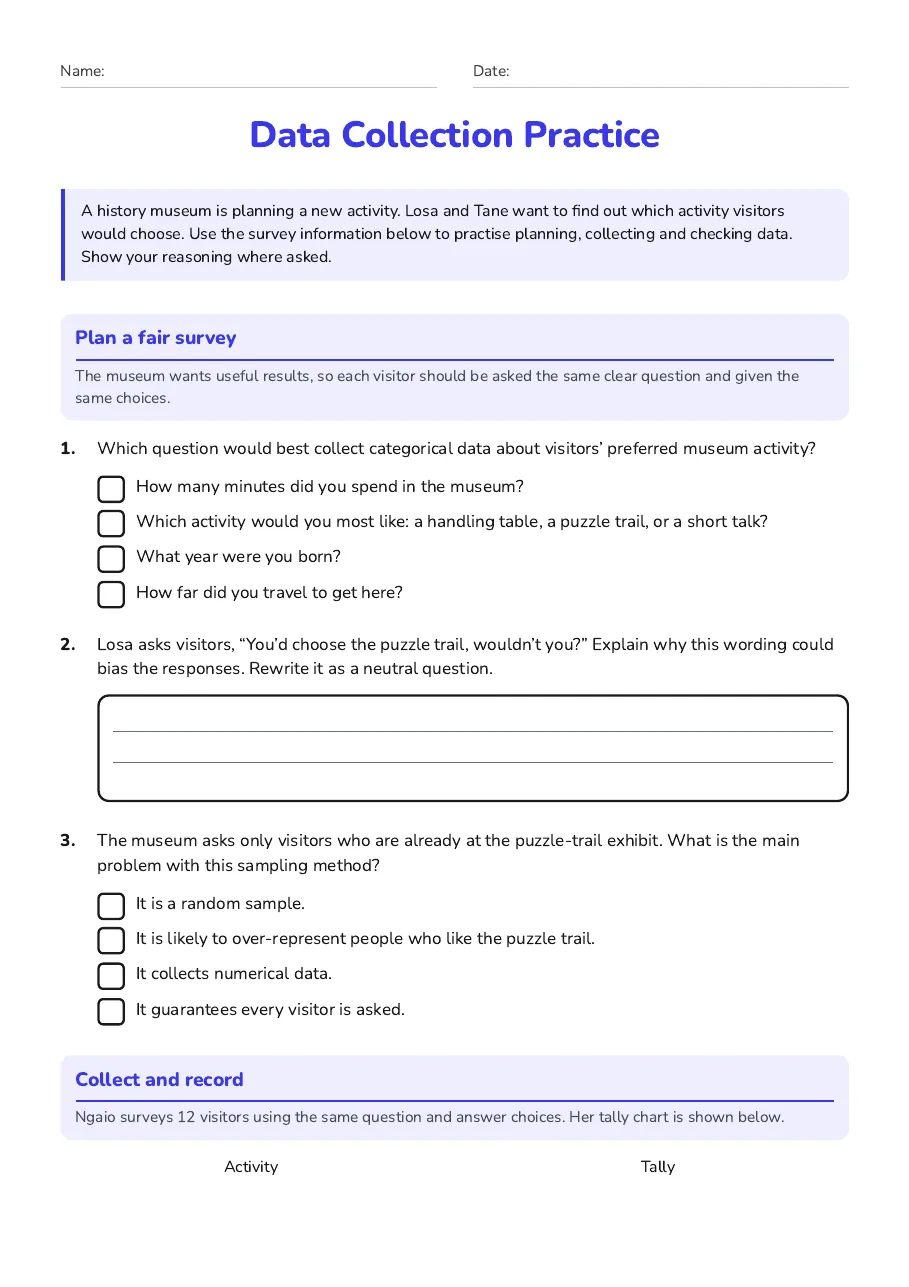
A history museum is planning a new activity. Losa and Tane want to find out which activity visitors would choose. Use the survey information below to practise planning, collecting and checking data. Show your reasoning where asked.

Plan a fair survey

The museum wants useful results, so each visitor should be asked the same clear question and given the same choices.

1.Which question would best collect categorical data about visitors’ preferred museum activity?
  • How many minutes did you spend in the museum?
  • Which activity would you most like: a handling table, a puzzle trail, or a short talk?
  • What year were you born?
  • How far did you travel to get here?
2.Losa asks visitors, “You’d choose the puzzle trail, wouldn’t you?” Explain why this wording could bias the responses. Rewrite it as a neutral question.
3.The museum asks only visitors who are already at the puzzle-trail exhibit. What is the main problem with this sampling method?
  • It is a random sample.
  • It is likely to over-represent people who like the puzzle trail.
  • It collects numerical data.
  • It guarantees every visitor is asked.

Collect and record

Ngaio surveys 12 visitors using the same question and answer choices. Her tally chart is shown below.

Activity

Tally

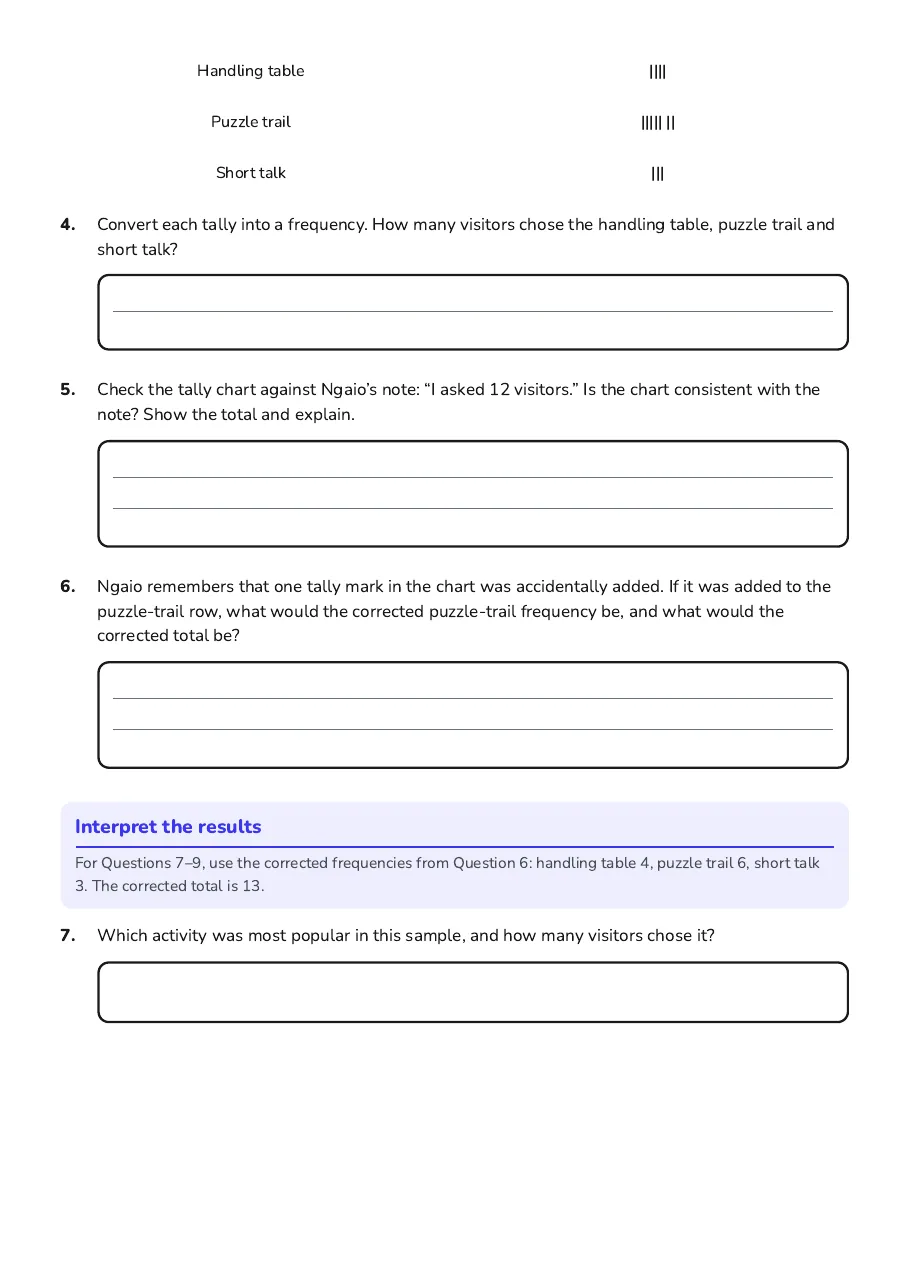
Handling table

||||

Puzzle trail

||||| ||

Short talk

|||

4.Convert each tally into a frequency. How many visitors chose the handling table, puzzle trail and short talk?
5.Check the tally chart against Ngaio’s note: “I asked 12 visitors.” Is the chart consistent with the note? Show the total and explain.
6.Ngaio remembers that one tally mark in the chart was accidentally added. If it was added to the puzzle-trail row, what would the corrected puzzle-trail frequency be, and what would the corrected total be?

Interpret the results

For Questions 7–9, use the corrected frequencies from Question 6: handling table 4, puzzle trail 6, short talk 3. The corrected total is 13.

7.Which activity was most popular in this sample, and how many visitors chose it?
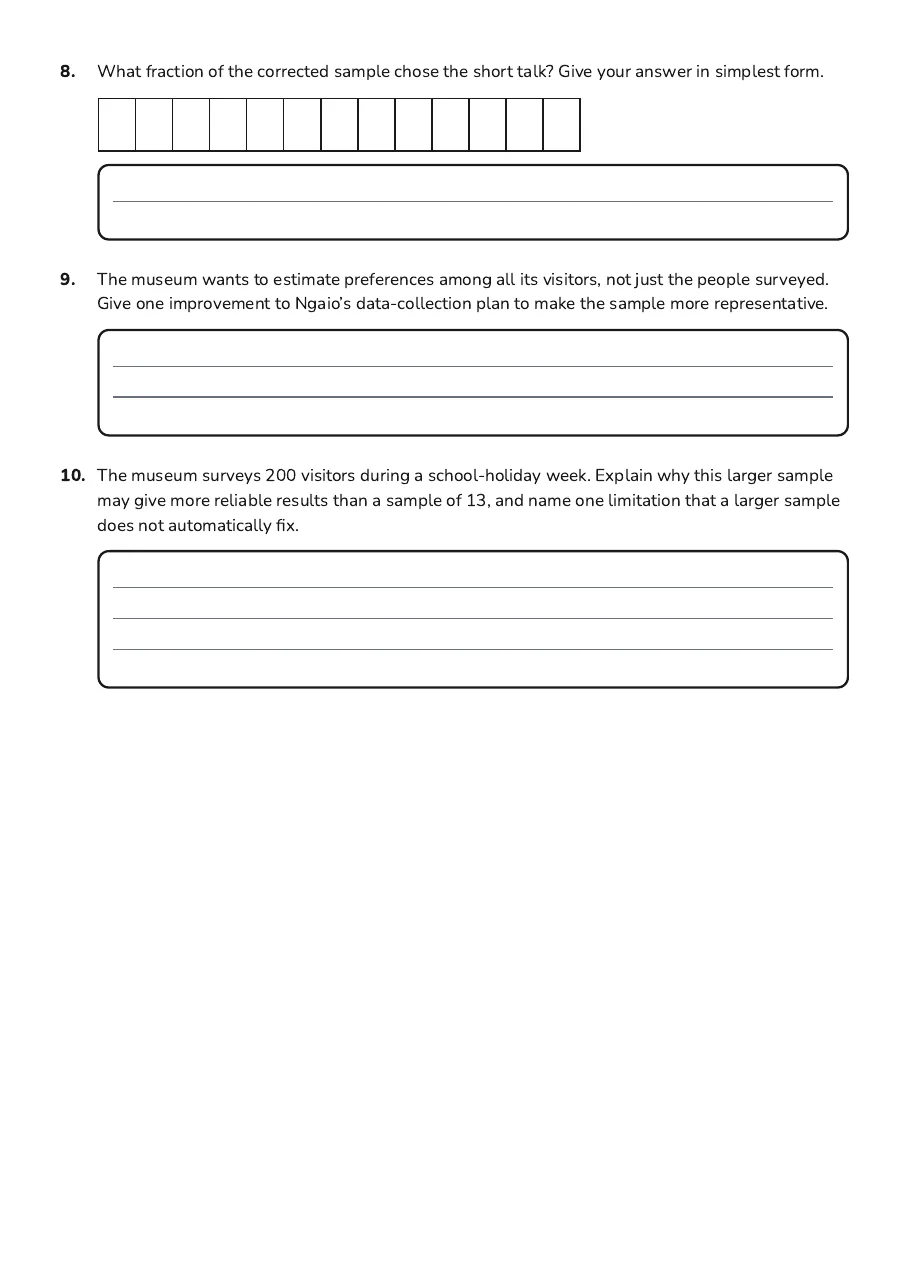
8.What fraction of the corrected sample chose the short talk? Give your answer in simplest form.
9.The museum wants to estimate preferences among all its visitors, not just the people surveyed. Give one improvement to Ngaio’s data-collection plan to make the sample more representative.
10.The museum surveys 200 visitors during a school-holiday week. Explain why this larger sample may give more reliable results than a sample of 13, and name one limitation that a larger sample does not automatically fix.

3 printable pages

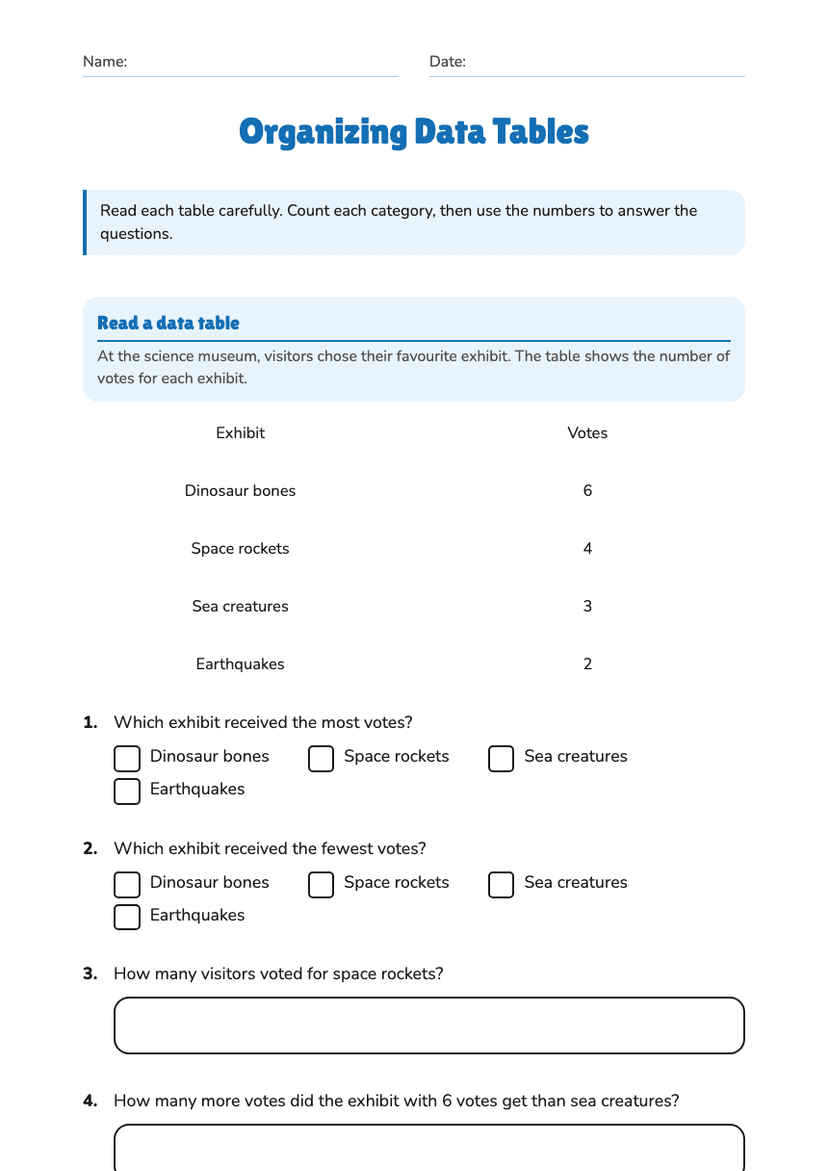
  • Data Collection Practice, page 1 of 3: Plan a fair survey, Collect and record

    Page 1

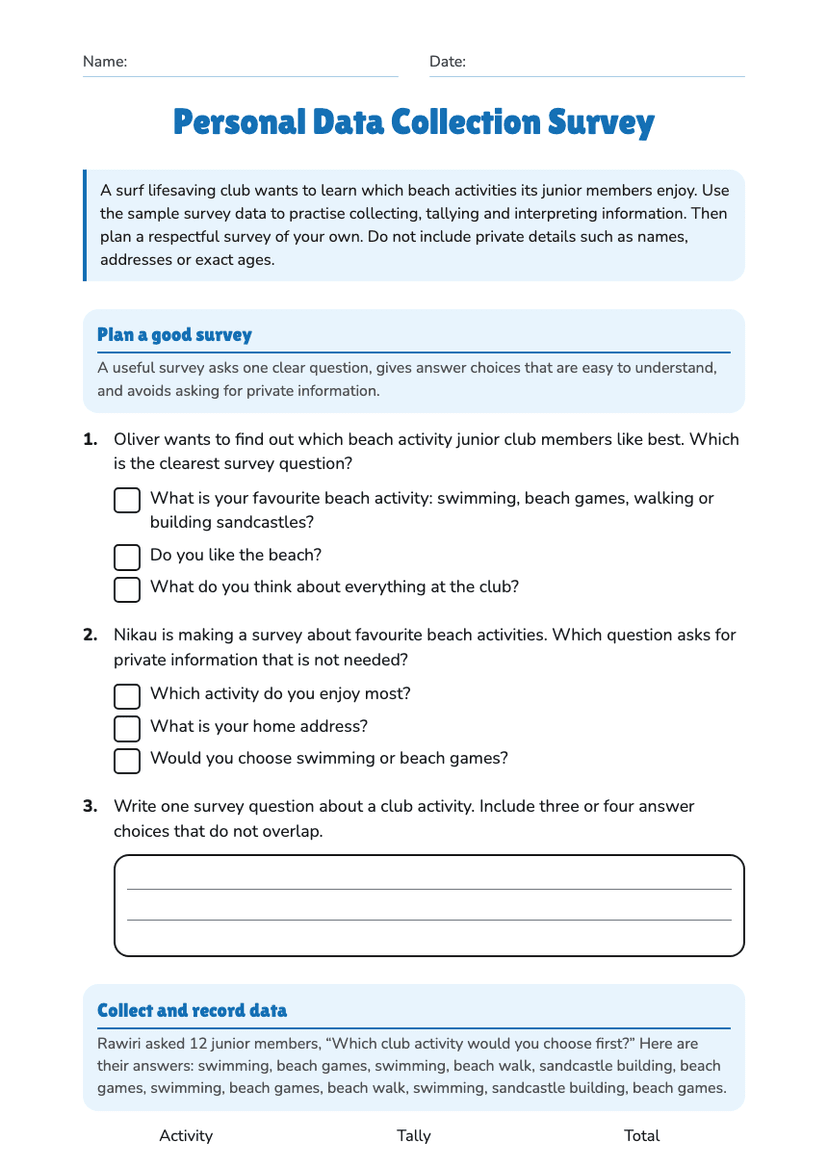
  • Data Collection Practice, page 2 of 3: Interpret the results

    Page 2

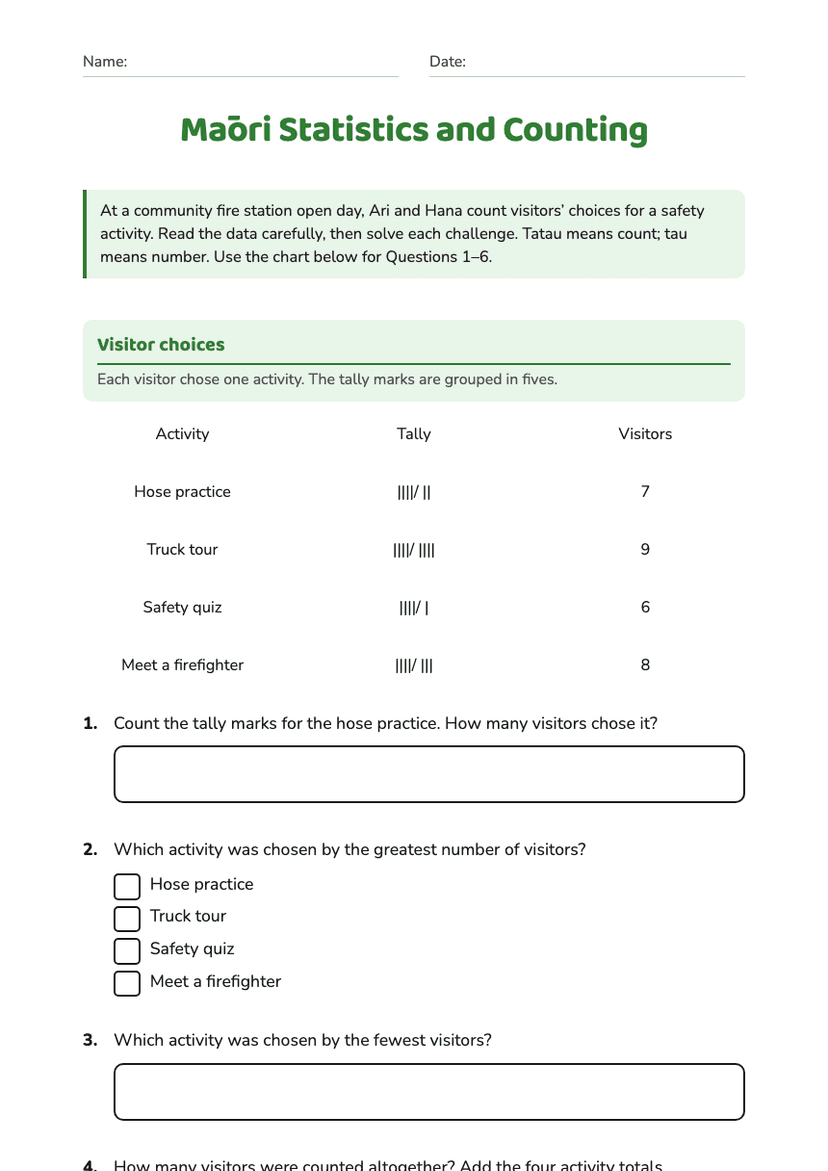
  • Data Collection Practice, page 3 of 3: 8. What fraction of the corrected sample chose the short talk? Give your answer in…

    Page 3

About This Worksheet

Free in Kuraplan

Sign up free, grab the PDF, and customize it for your class.

Print-Ready

Formatted for standard paper. Clean layout, easy to read.

AI-Generated

Created with Kuraplan's AI, designed for real classroom use.

For Teachers & Parents

Use in classrooms, for homework, tutoring, or homeschool.

Need a custom version of this worksheet?

Kuraplan's AI generates custom worksheets in seconds — differentiated for every learner, aligned to your curriculum.

Generate Custom Worksheets — Free
No credit card Curriculum-aligned Under 60 seconds