MathsFreePrintable
Māori Statistics Foundations Worksheet
A free maths worksheet ready for your classroom. Open in Kuraplan to grab the print-ready PDF, customize it for your students, or generate a fresh version in seconds.
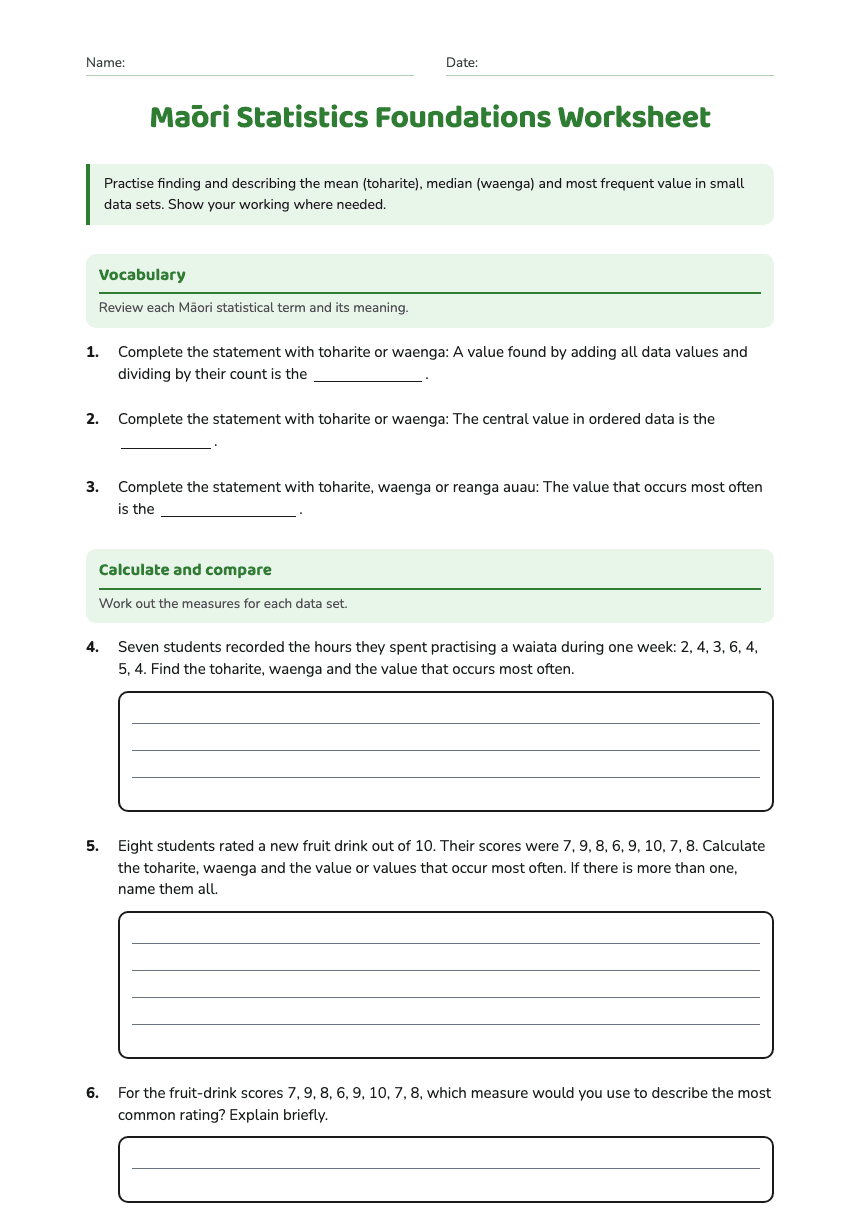
Name:Date:
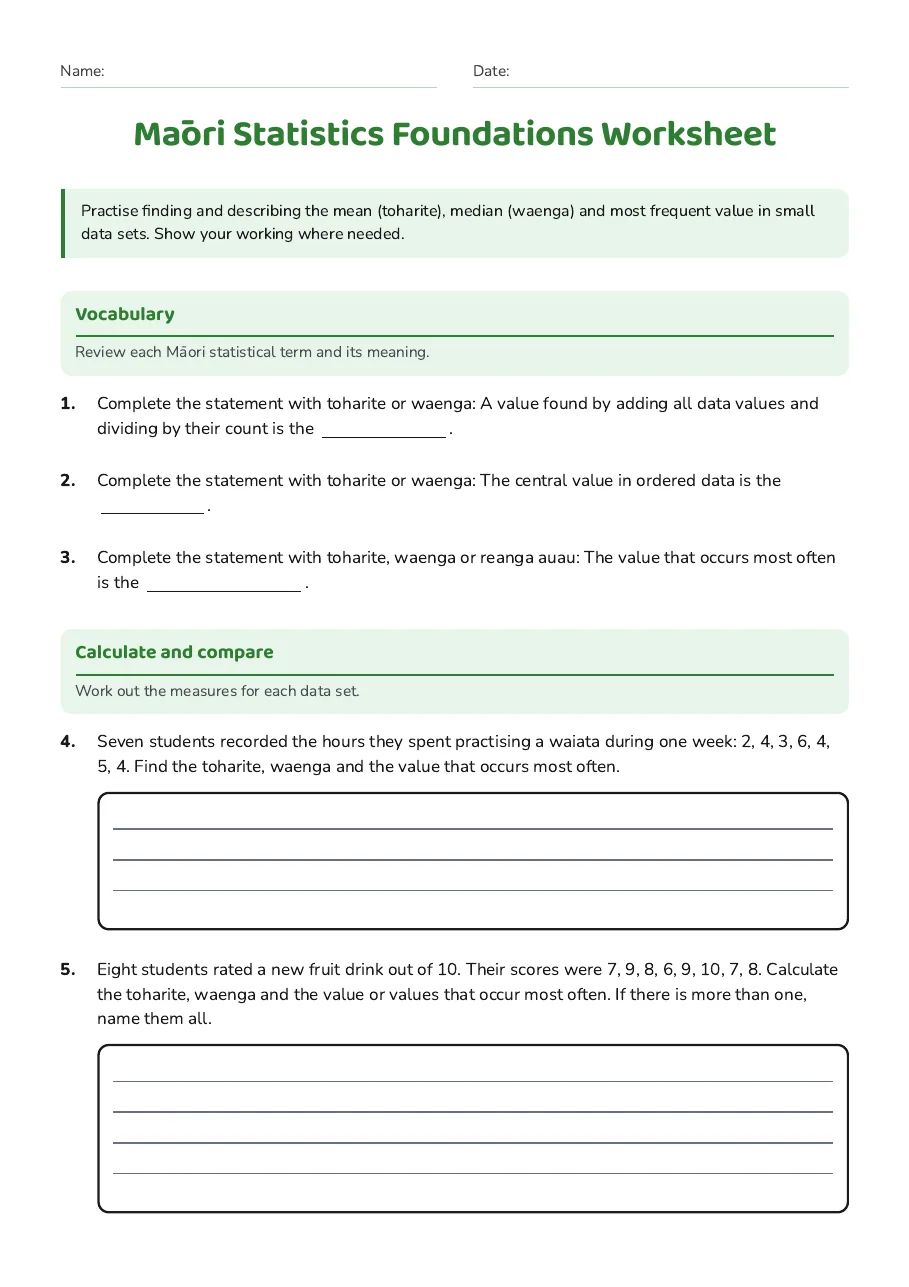
Māori Statistics Foundations Worksheet
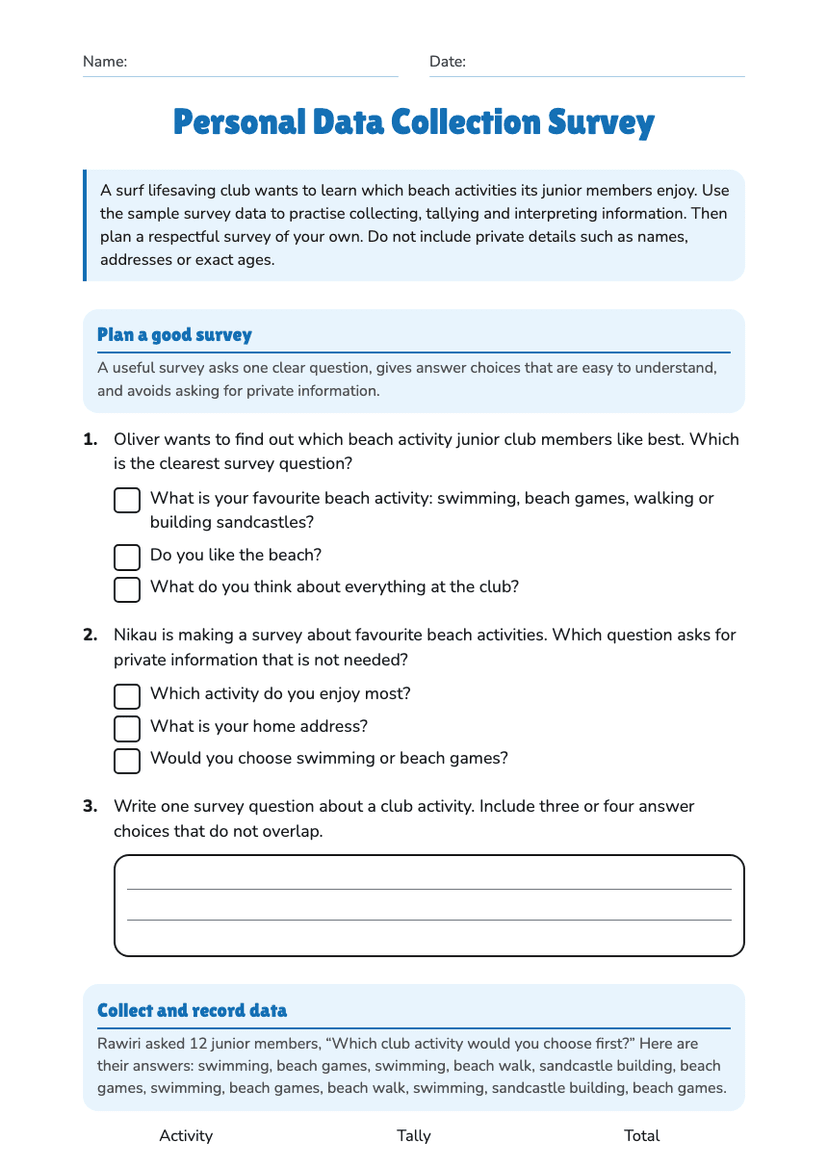
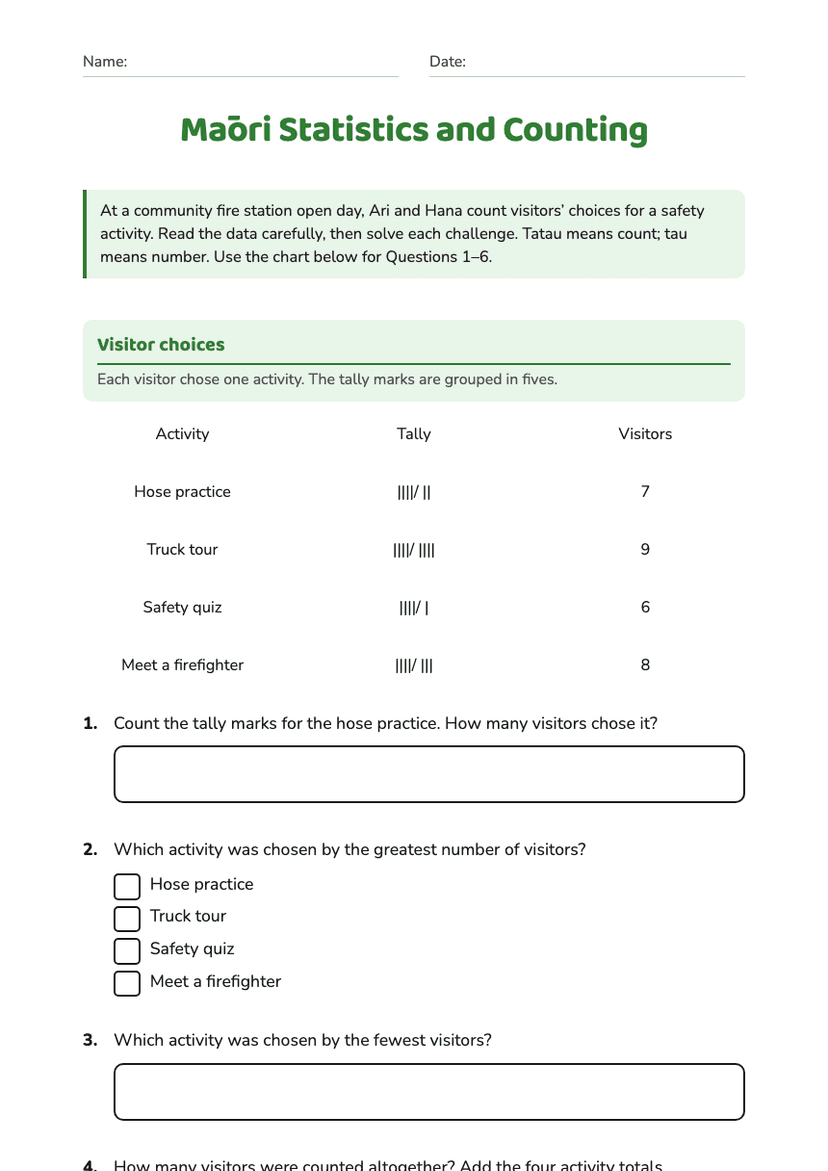
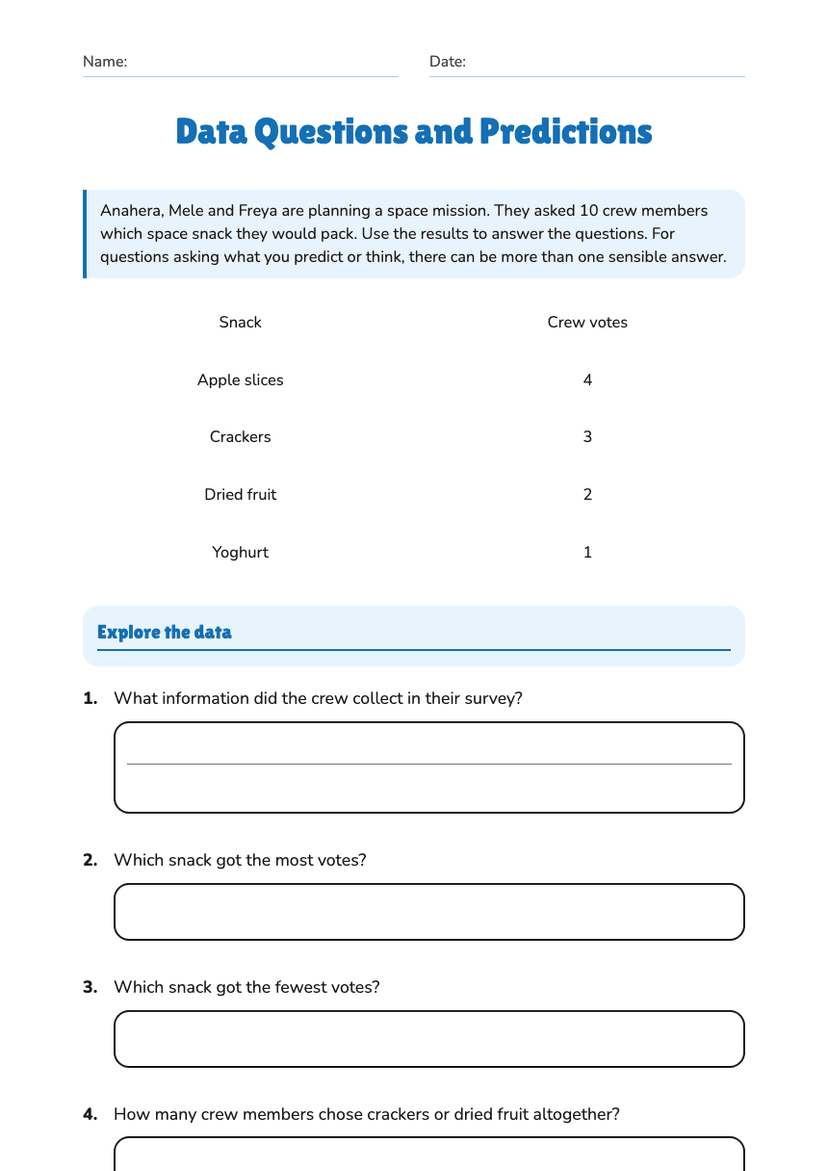
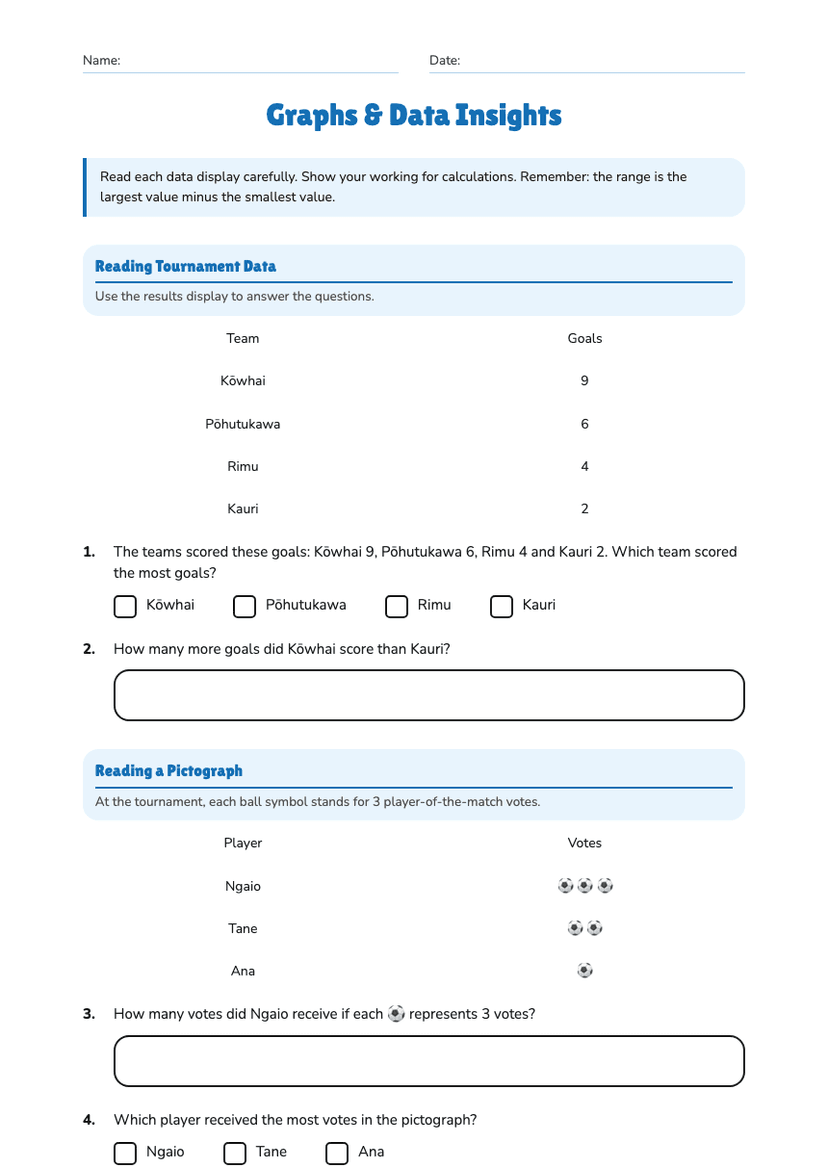
Practise finding and describing the mean (toharite), median (waenga) and most frequent value in small data sets. Show your working where needed.
Vocabulary
Review each Māori statistical term and its meaning.
1.Complete the statement with toharite or waenga: A value found by adding all data values and dividing by their count is the .
2.Complete the statement with toharite or waenga: The central value in ordered data is the .
3.Complete the statement with toharite, waenga or reanga auau: The value that occurs most often is the .
Calculate and compare
Work out the measures for each data set.
4.Seven students recorded the hours they spent practising a waiata during one week: 2, 4, 3, 6, 4, 5, 4. Find the toharite, waenga and the value that occurs most often.
5.Eight students rated a new fruit drink out of 10. Their scores were 7, 9, 8, 6, 9, 10, 7, 8. Calculate the toharite, waenga and the value or values that occur most often. If there is more than one, name them all.
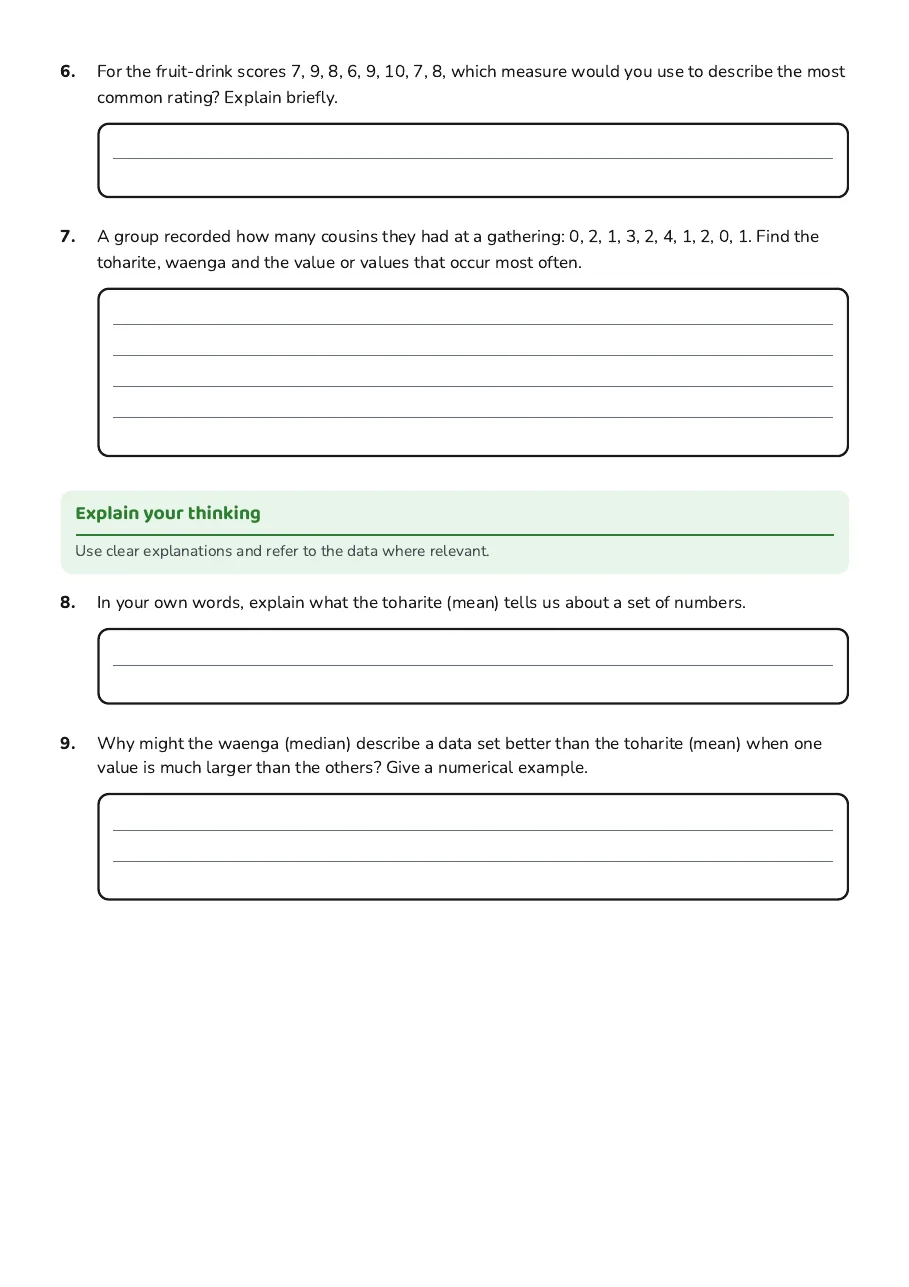
6.For the fruit-drink scores 7, 9, 8, 6, 9, 10, 7, 8, which measure would you use to describe the most common rating? Explain briefly.
7.A group recorded how many cousins they had at a gathering: 0, 2, 1, 3, 2, 4, 1, 2, 0, 1. Find the toharite, waenga and the value or values that occur most often.
Explain your thinking
Use clear explanations and refer to the data where relevant.
8.In your own words, explain what the toharite (mean) tells us about a set of numbers.
9.Why might the waenga (median) describe a data set better than the toharite (mean) when one value is much larger than the others? Give a numerical example.
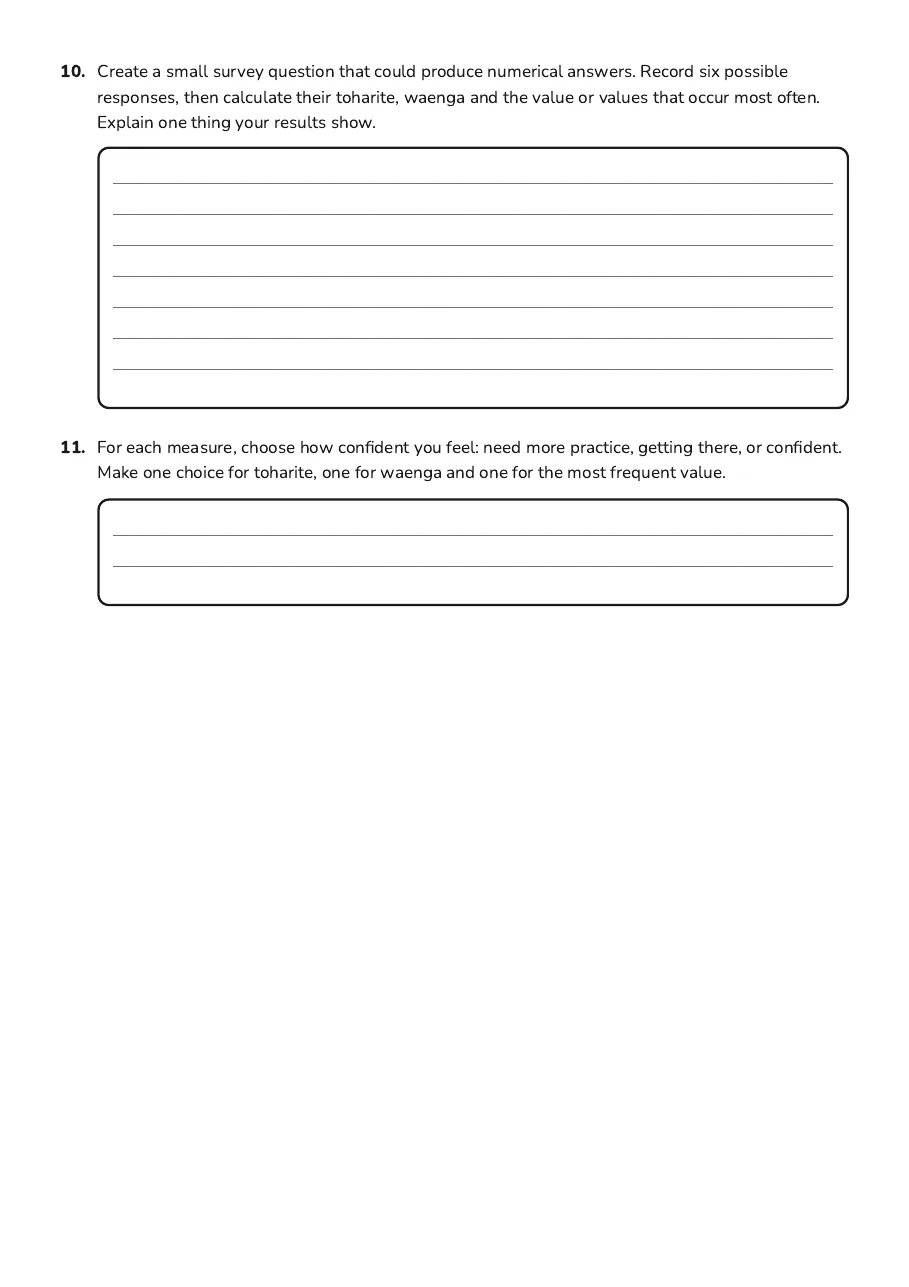
10.Create a small survey question that could produce numerical answers. Record six possible responses, then calculate their toharite, waenga and the value or values that occur most often. Explain one thing your results show.
11.For each measure, choose how confident you feel: need more practice, getting there, or confident. Make one choice for toharite, one for waenga and one for the most frequent value.
3 printable pages
Page 1
Page 2
Page 3
About This Worksheet
Free in Kuraplan
Sign up free, grab the PDF, and customize it for your class.
Print-Ready
Formatted for standard paper. Clean layout, easy to read.
AI-Generated
Created with Kuraplan's AI, designed for real classroom use.
For Teachers & Parents
Use in classrooms, for homework, tutoring, or homeschool.
Need a custom version of this worksheet?
Kuraplan's AI generates custom worksheets in seconds — differentiated for every learner, aligned to your curriculum.
Generate Custom Worksheets — Free No credit card Curriculum-aligned Under 60 seconds