MathsFreePrintable

Probability and Data Investigations

A free maths worksheet ready for your classroom. Open in Kuraplan to grab the print-ready PDF, customize it for your students, or generate a fresh version in seconds.
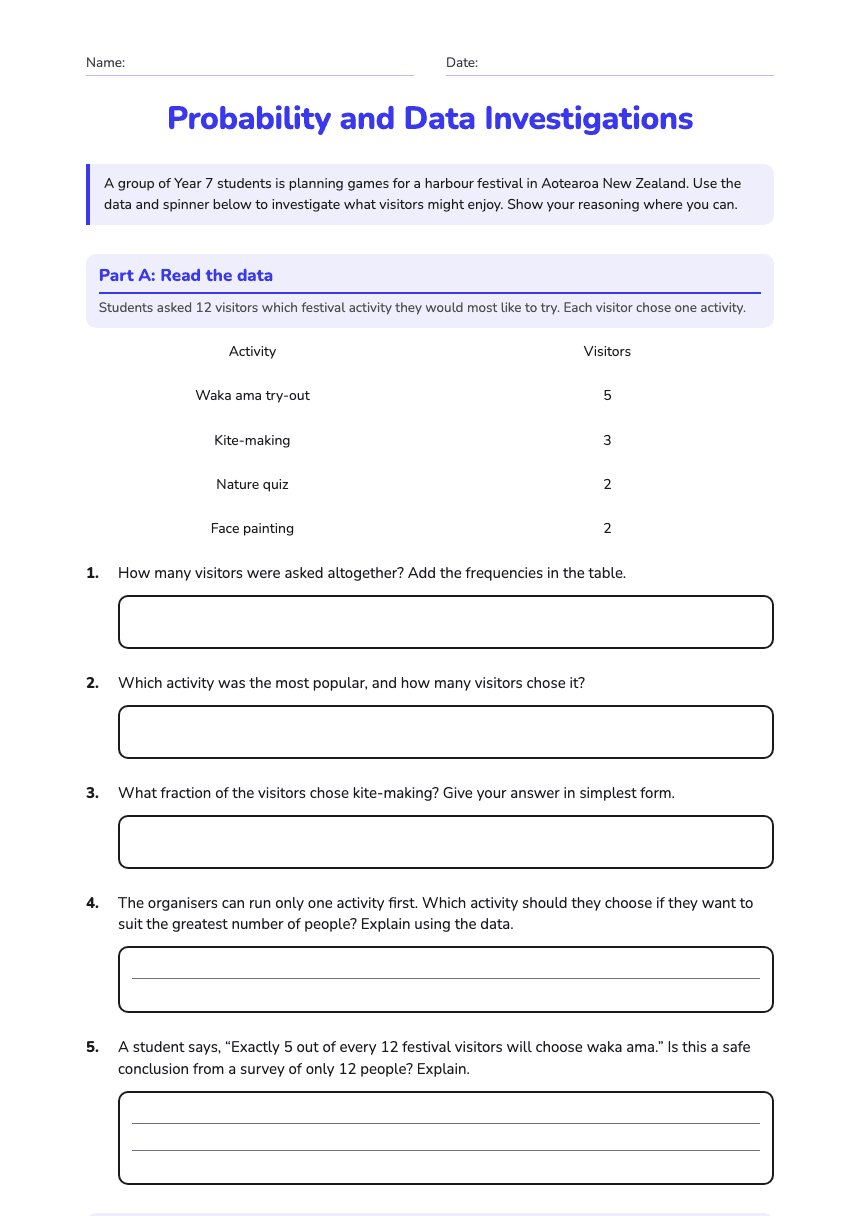
Probability and Data Investigations worksheet preview
Name:Date:

Probability and Data Investigations

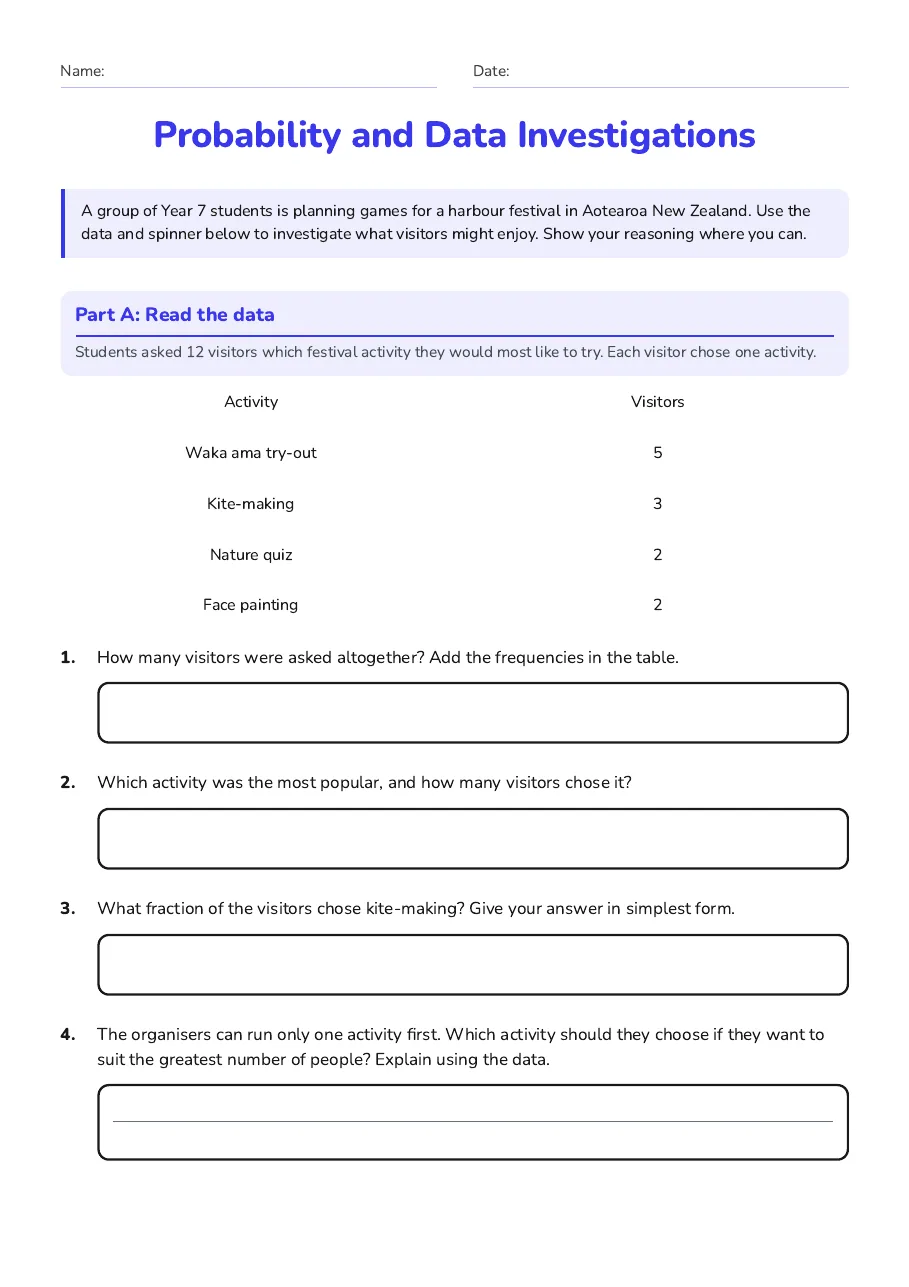
A group of Year 7 students is planning games for a harbour festival in Aotearoa New Zealand. Use the data and spinner below to investigate what visitors might enjoy. Show your reasoning where you can.

Part A: Read the data

Students asked 12 visitors which festival activity they would most like to try. Each visitor chose one activity.

Activity

Visitors

Waka ama try-out

5

Kite-making

3

Nature quiz

2

Face painting

2

1.How many visitors were asked altogether? Add the frequencies in the table.
2.Which activity was the most popular, and how many visitors chose it?
3.What fraction of the visitors chose kite-making? Give your answer in simplest form.
4.The organisers can run only one activity first. Which activity should they choose if they want to suit the greatest number of people? Explain using the data.
5.A student says, “Exactly 5 out of every 12 festival visitors will choose waka ama.” Is this a safe conclusion from a survey of only 12 people? Explain.

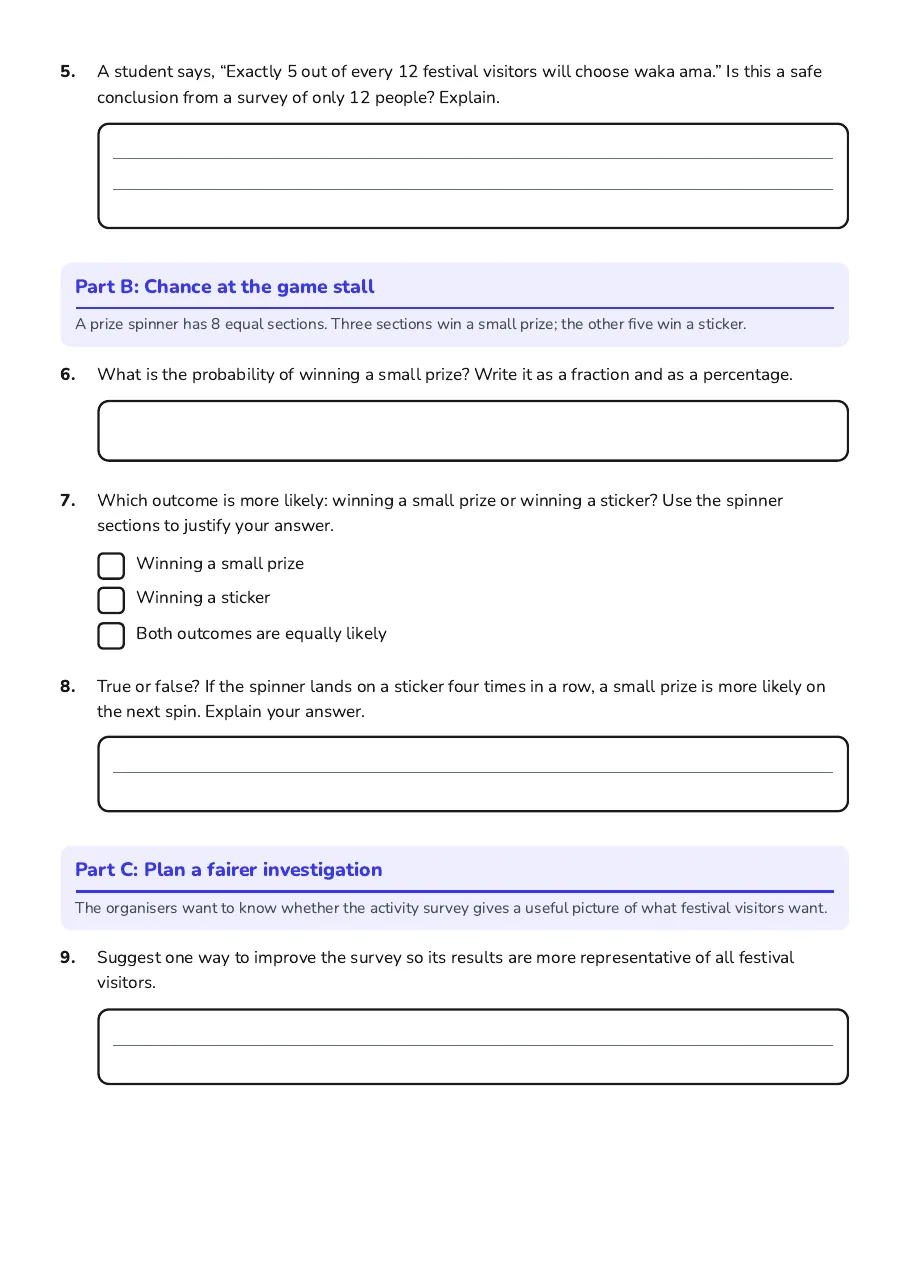
Part B: Chance at the game stall

A prize spinner has 8 equal sections. Three sections win a small prize; the other five win a sticker.

6.What is the probability of winning a small prize? Write it as a fraction and as a percentage.
7.Which outcome is more likely: winning a small prize or winning a sticker? Use the spinner sections to justify your answer.
  • Winning a small prize
  • Winning a sticker
  • Both outcomes are equally likely
8.True or false? If the spinner lands on a sticker four times in a row, a small prize is more likely on the next spin. Explain your answer.

Part C: Plan a fairer investigation

The organisers want to know whether the activity survey gives a useful picture of what festival visitors want.

9.Suggest one way to improve the survey so its results are more representative of all festival visitors.
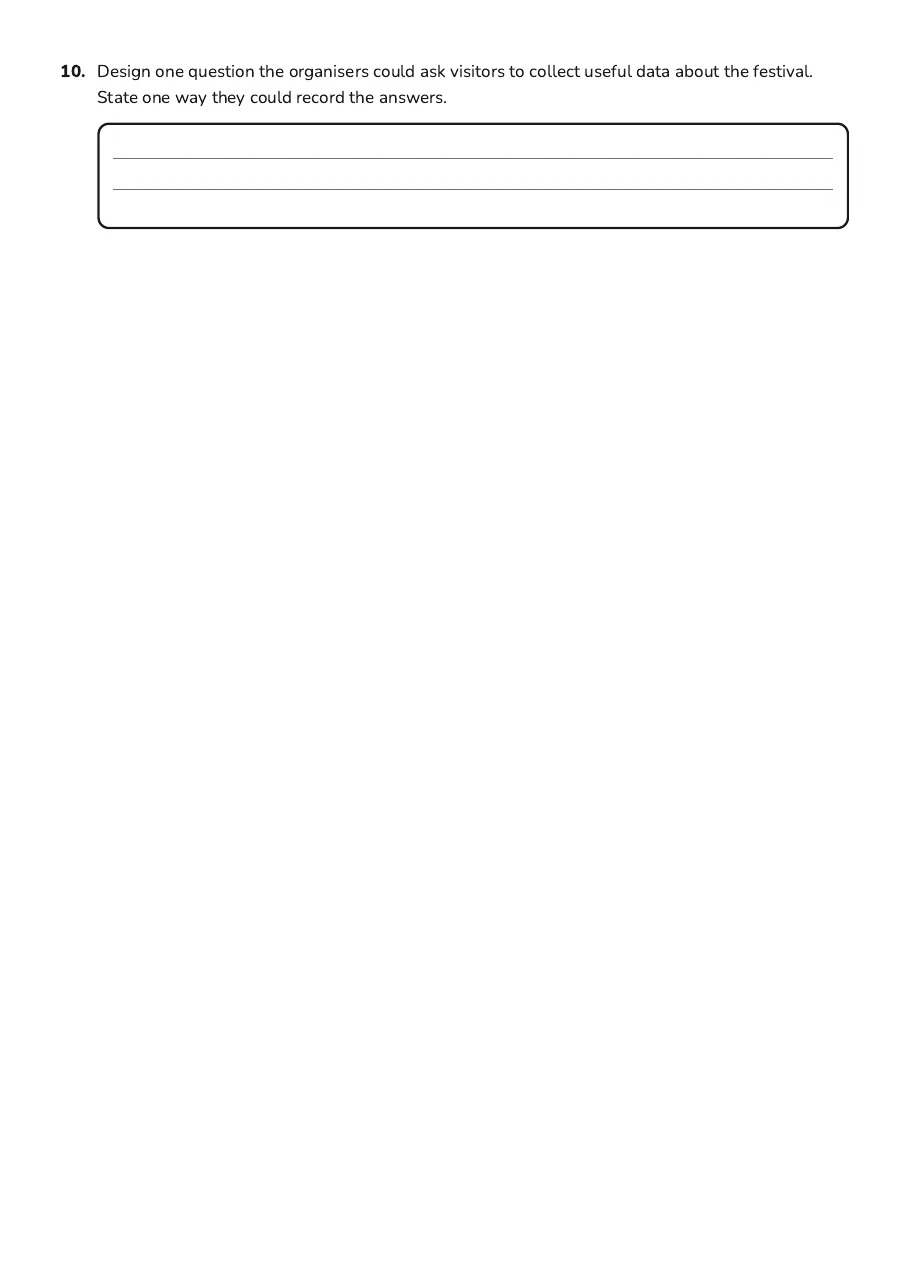
10.Design one question the organisers could ask visitors to collect useful data about the festival. State one way they could record the answers.

3 printable pages

  • Probability and Data Investigations, page 1 of 3: Part A: Read the data

    Page 1

  • Probability and Data Investigations, page 2 of 3: Part B: Chance at the game stall, Part C: Plan a fairer investigation

    Page 2

  • Probability and Data Investigations, page 3 of 3: 10. Design one question the organisers could ask visitors to collect useful data about…

    Page 3

About This Worksheet

Free in Kuraplan

Sign up free, grab the PDF, and customize it for your class.

Print-Ready

Formatted for standard paper. Clean layout, easy to read.

AI-Generated

Created with Kuraplan's AI, designed for real classroom use.

For Teachers & Parents

Use in classrooms, for homework, tutoring, or homeschool.

Need a custom version of this worksheet?

Kuraplan's AI generates custom worksheets in seconds — differentiated for every learner, aligned to your curriculum.

Generate Custom Worksheets — Free
No credit card Curriculum-aligned Under 60 seconds