MathsFreePrintable

Statistics in Action Introduction

A free maths worksheet ready for your classroom. Open in Kuraplan to grab the print-ready PDF, customize it for your students, or generate a fresh version in seconds.
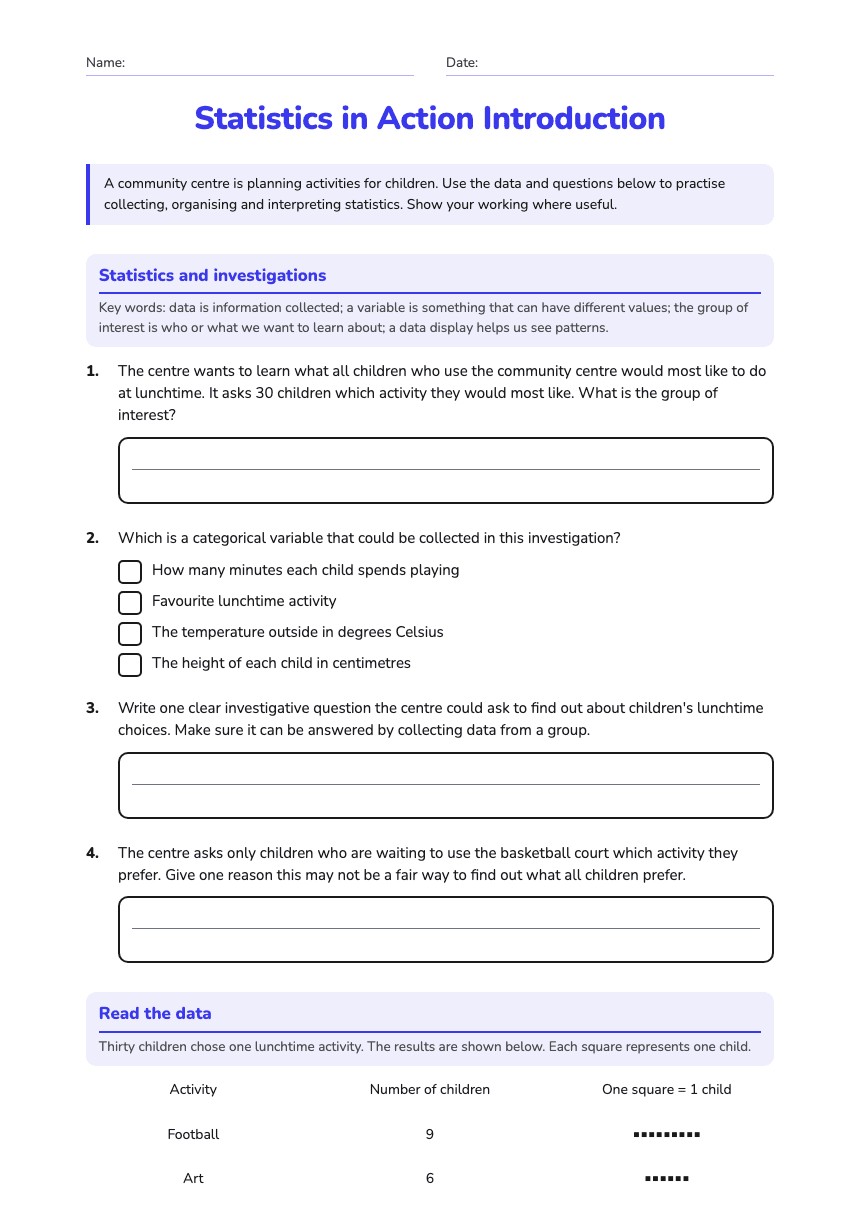
Statistics in Action Introduction worksheet preview
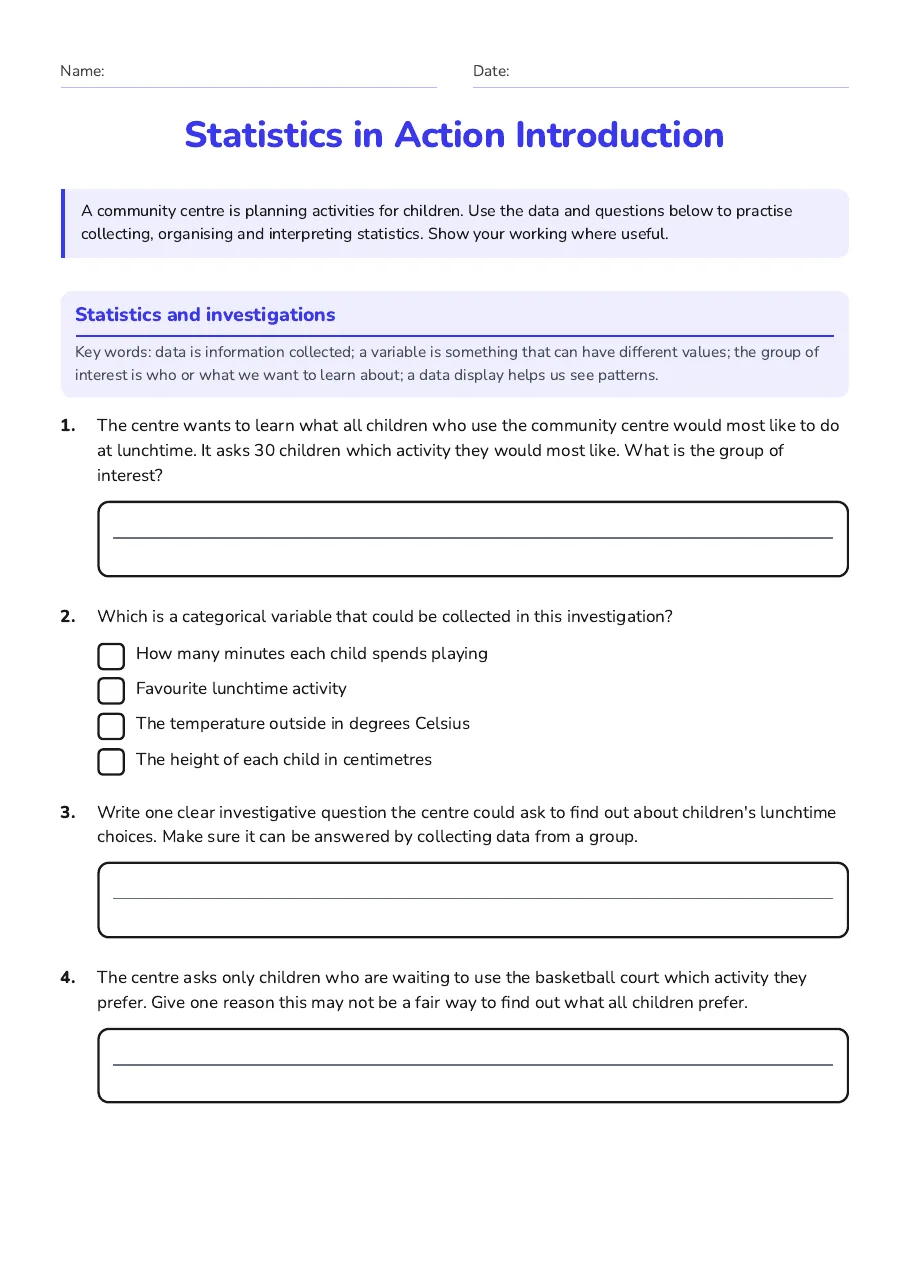
Name:Date:

Statistics in Action Introduction

A community centre is planning activities for children. Use the data and questions below to practise collecting, organising and interpreting statistics. Show your working where useful.

Statistics and investigations

Key words: data is information collected; a variable is something that can have different values; the group of interest is who or what we want to learn about; a data display helps us see patterns.

1.The centre wants to learn what all children who use the community centre would most like to do at lunchtime. It asks 30 children which activity they would most like. What is the group of interest?
2.Which is a categorical variable that could be collected in this investigation?
  • How many minutes each child spends playing
  • Favourite lunchtime activity
  • The temperature outside in degrees Celsius
  • The height of each child in centimetres
3.Write one clear investigative question the centre could ask to find out about children's lunchtime choices. Make sure it can be answered by collecting data from a group.
4.The centre asks only children who are waiting to use the basketball court which activity they prefer. Give one reason this may not be a fair way to find out what all children prefer.

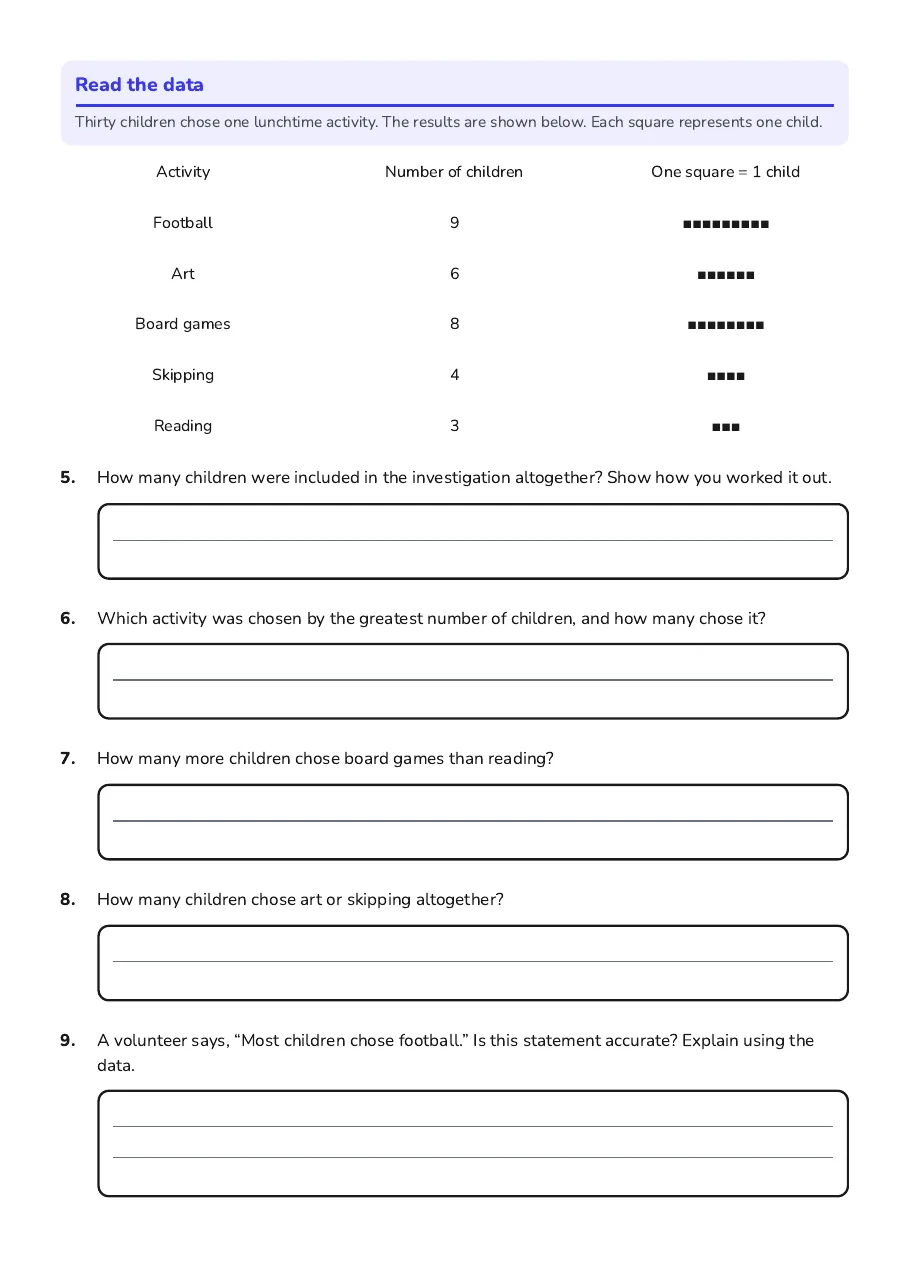
Read the data

Thirty children chose one lunchtime activity. The results are shown below. Each square represents one child.

Activity

Number of children

One square = 1 child

Football

9

■■■■■■■■■

Art

6

■■■■■■

Board games

8

■■■■■■■■

Skipping

4

■■■■

Reading

3

■■■

5.How many children were included in the investigation altogether? Show how you worked it out.
6.Which activity was chosen by the greatest number of children, and how many chose it?
7.How many more children chose board games than reading?
8.How many children chose art or skipping altogether?
9.A volunteer says, “Most children chose football.” Is this statement accurate? Explain using the data.
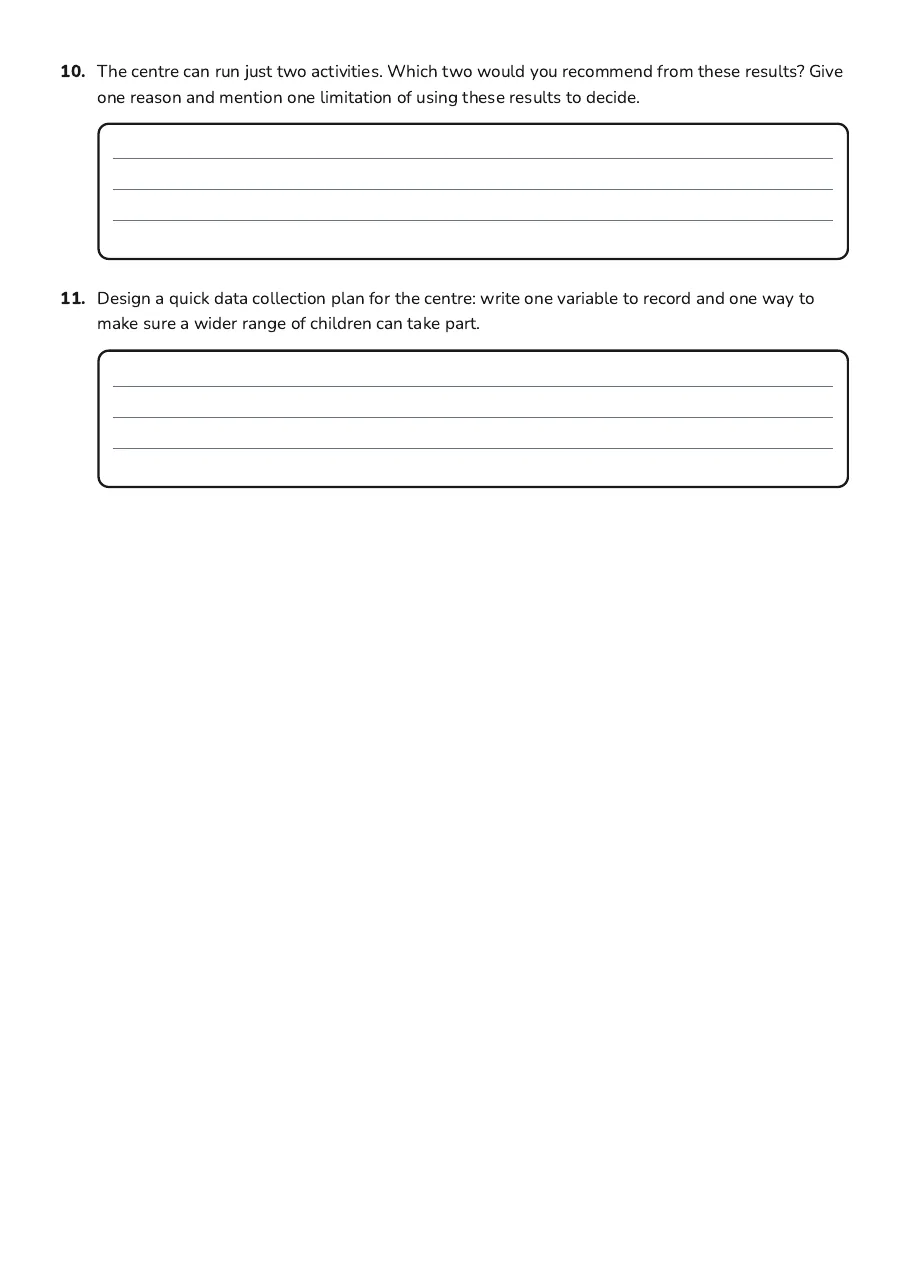
10.The centre can run just two activities. Which two would you recommend from these results? Give one reason and mention one limitation of using these results to decide.
11.Design a quick data collection plan for the centre: write one variable to record and one way to make sure a wider range of children can take part.

3 printable pages

  • Statistics in Action Introduction, page 1 of 3: Statistics and investigations

    Page 1

  • Statistics in Action Introduction, page 2 of 3: Read the data

    Page 2

  • Statistics in Action Introduction, page 3 of 3: 10. The centre can run just two activities. Which two would you recommend from these…

    Page 3

About This Worksheet

Free in Kuraplan

Sign up free, grab the PDF, and customize it for your class.

Print-Ready

Formatted for standard paper. Clean layout, easy to read.

AI-Generated

Created with Kuraplan's AI, designed for real classroom use.

For Teachers & Parents

Use in classrooms, for homework, tutoring, or homeschool.

Need a custom version of this worksheet?

Kuraplan's AI generates custom worksheets in seconds — differentiated for every learner, aligned to your curriculum.

Generate Custom Worksheets — Free
No credit card Curriculum-aligned Under 60 seconds