MathsFreePrintable

Statistics in Real Life

A free maths worksheet ready for your classroom. Open in Kuraplan to grab the print-ready PDF, customize it for your students, or generate a fresh version in seconds.
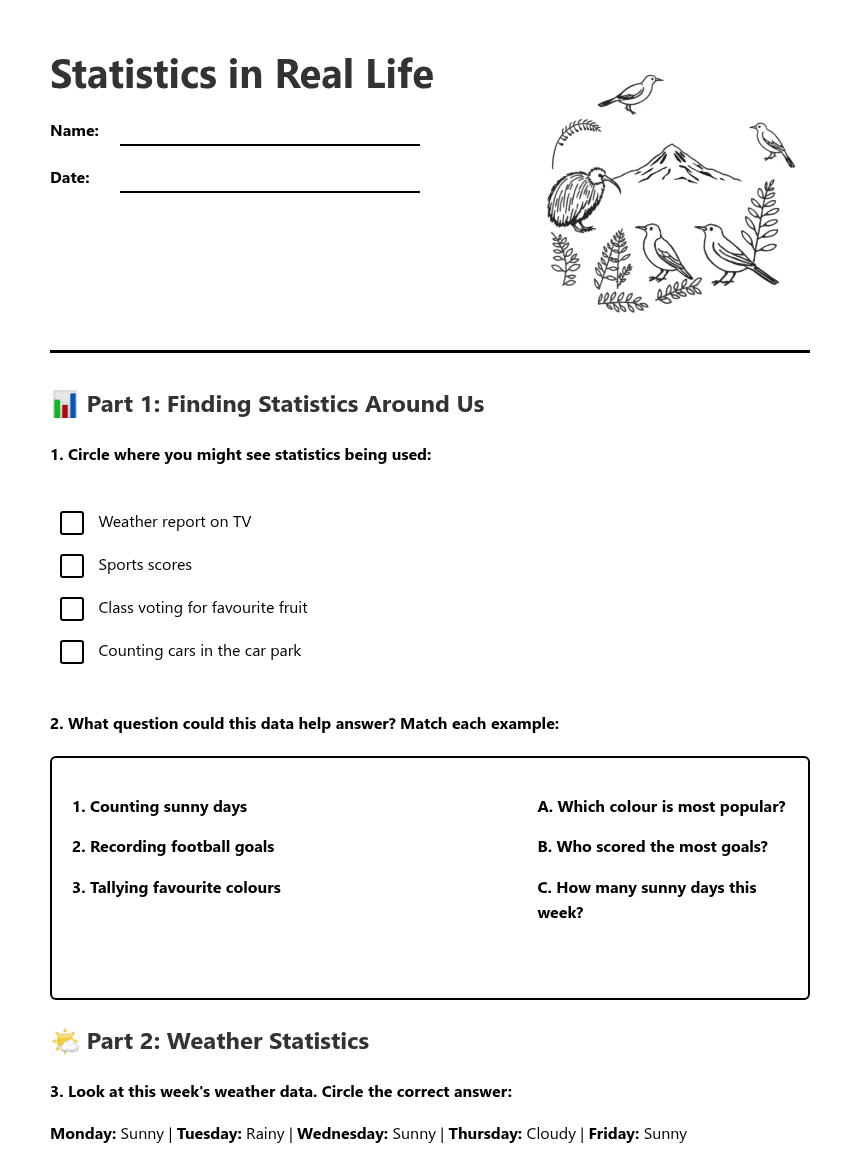
Statistics in Real Life worksheet preview

Statistics in Real Life

Statistics in Real Life

Children collecting data with charts and graphs

📊 Part 1: Finding Statistics Around Us

1. Circle where you might see statistics being used:

Weather report on TV

Sports scores

Class voting for favourite fruit

Counting cars in the car park

2. What question could this data help answer? Match each example:
1. Counting sunny days
2. Recording football goals
3. Tallying favourite colours
A. Which colour is most popular?
B. Who scored the most goals?
C. How many sunny days this week?

🌤️ Part 2: Weather Statistics

3. Look at this week's weather data. Circle the correct answer:

Monday: Sunny | Tuesday: Rainy | Wednesday: Sunny | Thursday: Cloudy | Friday: Sunny

Which weather happened the most?

Sunny

Rainy

Cloudy

4. Complete this sentence about the weather data:

I notice that it was _____________ for _____ days this week. This was _____________ than rainy days.

⚽ Part 3: Sports Statistics

5. Here are the goals scored by different players:

Sam: 4 goals | Emma: 6 goals | Jake: 2 goals | Lily: 5 goals

Who scored the most goals?
6. Draw tally marks to show each player's goals:
7. Put the players in order from most goals to least goals:

1st: _____________ 2nd: _____________ 3rd: _____________ 4th: _____________

🍎 Part 4: School Statistics

8. Our class voted for their favourite fruit. Here are the results:

Apples: 8 votes | Bananas: 5 votes | Oranges: 3 votes | Grapes: 6 votes

Which fruit was the most popular?

Apples

Bananas

Oranges

Grapes

9. How many more people chose apples than oranges?
10. Complete this "I notice" statement:

🤔 Part 5: Thinking About Statistics

11. Why do you think people collect data and use statistics? Check all good reasons:

To find out what is most popular

To help make decisions

To understand what happens around us

To compare different things

12. Draw a picture showing how you could collect data at school:
13. What is one question you would like to find the answer to using statistics?

About This Worksheet

Free in Kuraplan

Sign up free, grab the PDF, and customize it for your class.

Print-Ready

Formatted for standard paper. Clean layout, easy to read.

AI-Generated

Created with Kuraplan's AI, designed for real classroom use.

For Teachers & Parents

Use in classrooms, for homework, tutoring, or homeschool.

Need a custom version of this worksheet?

Kuraplan's AI generates custom worksheets in seconds — differentiated for every learner, aligned to your curriculum.

Generate Custom Worksheets — Free


No credit card Curriculum-aligned Under 60 seconds





