MathsFreePrintable

Statistics Reflection Assessment

A free maths worksheet ready for your classroom. Open in Kuraplan to grab the print-ready PDF, customize it for your students, or generate a fresh version in seconds.
Statistics Reflection Assessment worksheet preview
Name:Date:

Statistics Reflection Assessment

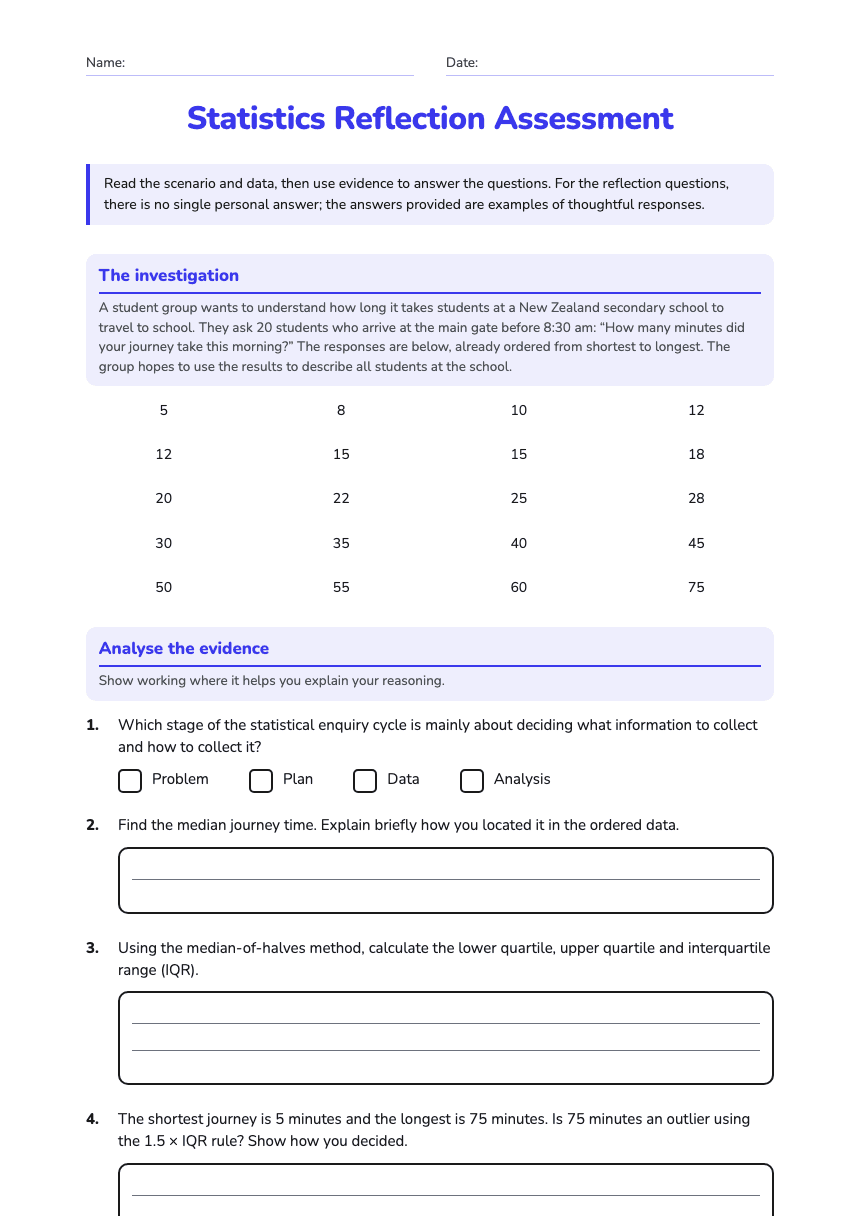
Read the scenario and data, then use evidence to answer the questions. For the reflection questions, there is no single personal answer; the answers provided are examples of thoughtful responses.

The investigation

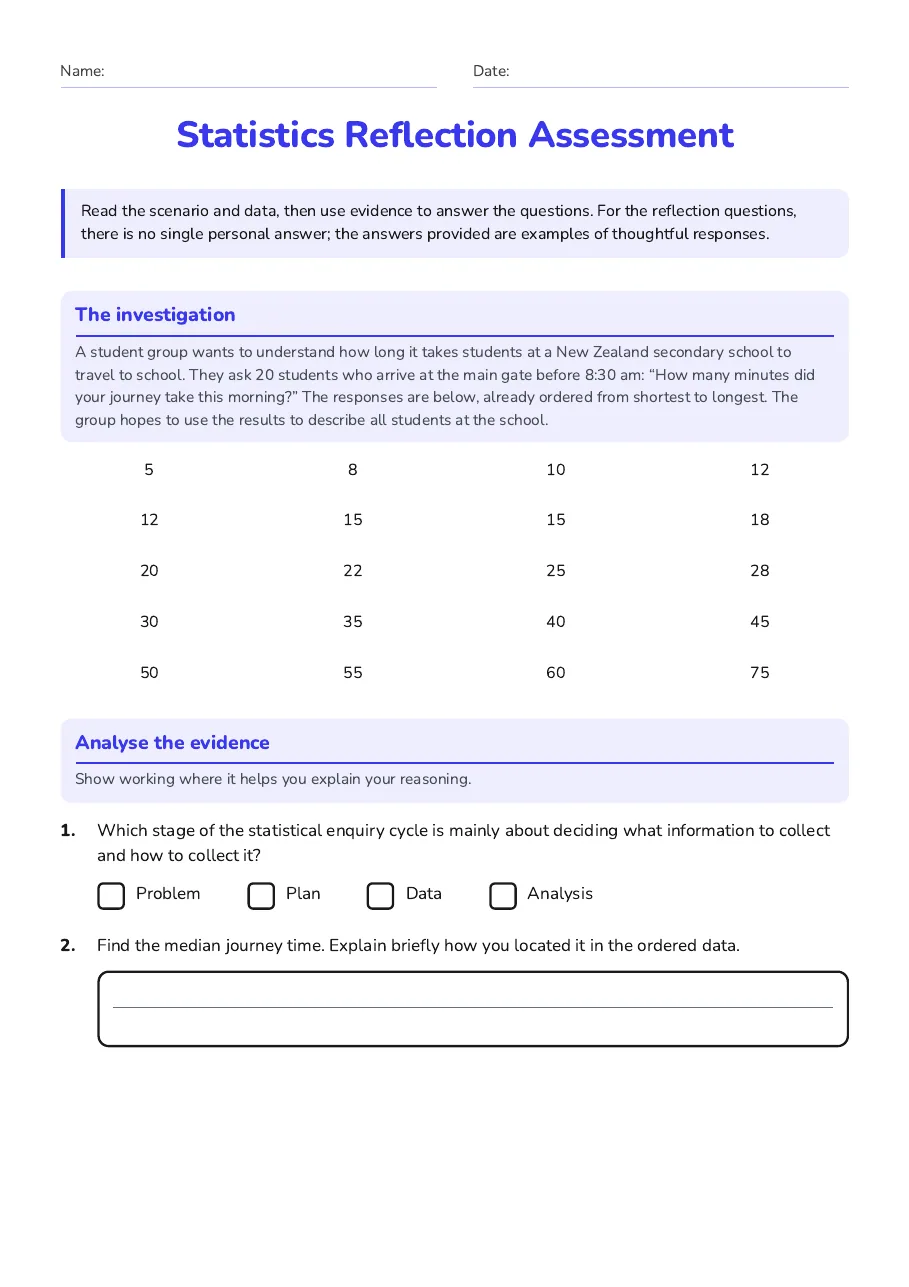
A student group wants to understand how long it takes students at a New Zealand secondary school to travel to school. They ask 20 students who arrive at the main gate before 8:30 am: “How many minutes did your journey take this morning?” The responses are below, already ordered from shortest to longest. The group hopes to use the results to describe all students at the school.

5

8

10

12

12

15

15

18

20

22

25

28

30

35

40

45

50

55

60

75

Analyse the evidence

Show working where it helps you explain your reasoning.

1.Which stage of the statistical enquiry cycle is mainly about deciding what information to collect and how to collect it?
  • Problem
  • Plan
  • Data
  • Analysis
2.Find the median journey time. Explain briefly how you located it in the ordered data.
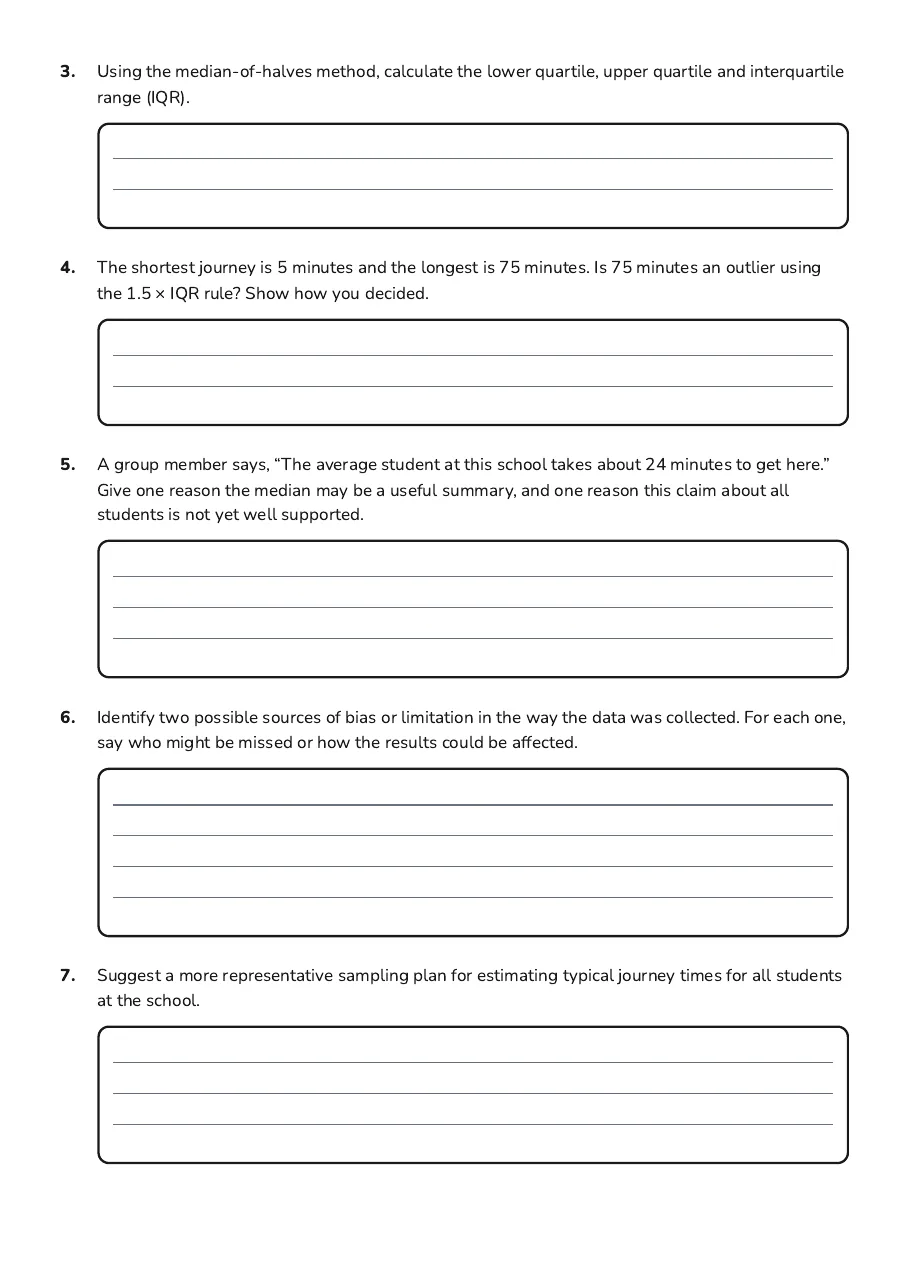
3.Using the median-of-halves method, calculate the lower quartile, upper quartile and interquartile range (IQR).
4.The shortest journey is 5 minutes and the longest is 75 minutes. Is 75 minutes an outlier using the 1.5 × IQR rule? Show how you decided.
5.A group member says, “The average student at this school takes about 24 minutes to get here.” Give one reason the median may be a useful summary, and one reason this claim about all students is not yet well supported.
6.Identify two possible sources of bias or limitation in the way the data was collected. For each one, say who might be missed or how the results could be affected.
7.Suggest a more representative sampling plan for estimating typical journey times for all students at the school.
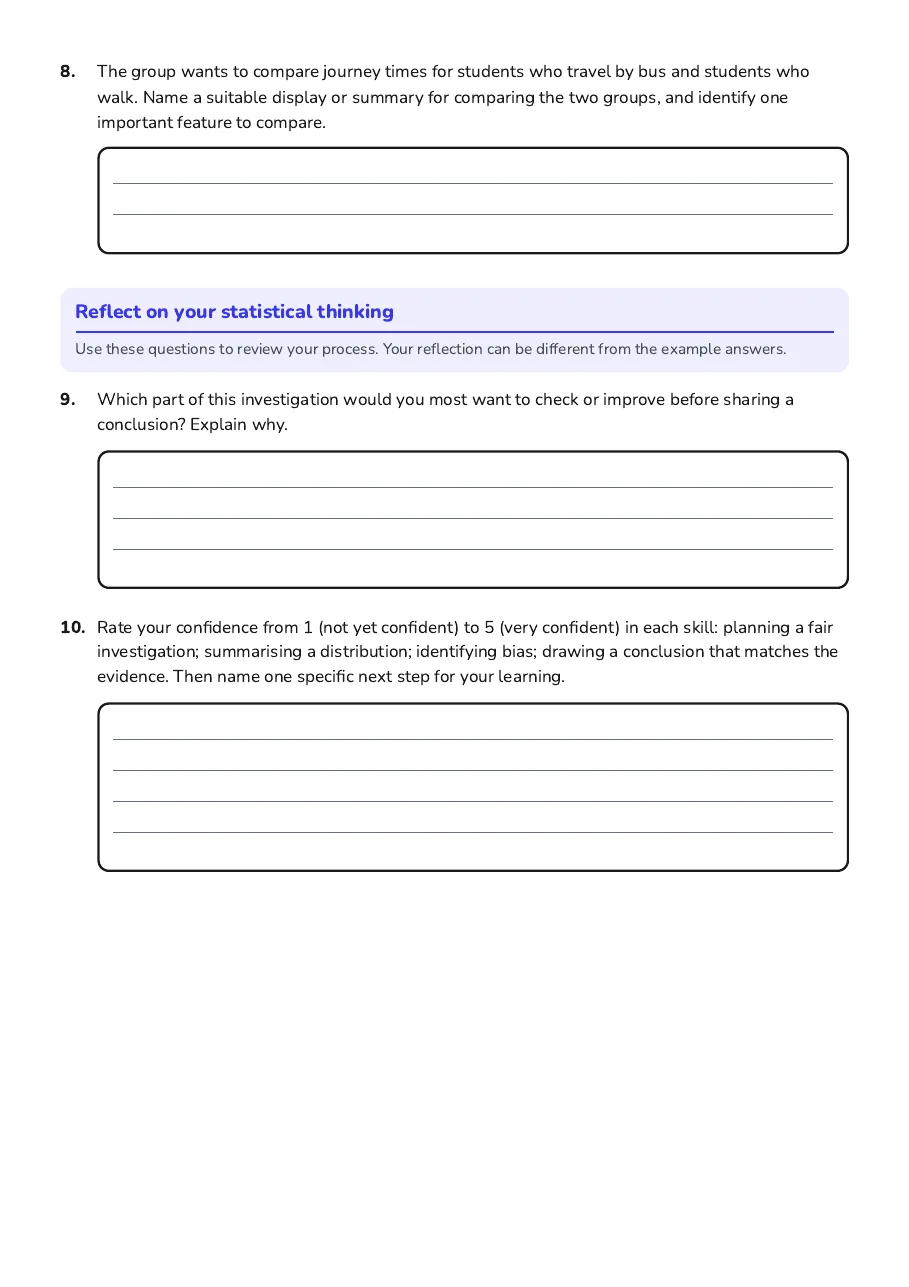
8.The group wants to compare journey times for students who travel by bus and students who walk. Name a suitable display or summary for comparing the two groups, and identify one important feature to compare.

Reflect on your statistical thinking

Use these questions to review your process. Your reflection can be different from the example answers.

9.Which part of this investigation would you most want to check or improve before sharing a conclusion? Explain why.
10.Rate your confidence from 1 (not yet confident) to 5 (very confident) in each skill: planning a fair investigation; summarising a distribution; identifying bias; drawing a conclusion that matches the evidence. Then name one specific next step for your learning.

3 printable pages

  • Statistics Reflection Assessment, page 1 of 3: The investigation, Analyse the evidence

    Page 1

  • Statistics Reflection Assessment, page 2 of 3: 3. Using the median-of-halves method, calculate the lower quartile, upper quartile and…

    Page 2

  • Statistics Reflection Assessment, page 3 of 3: Reflect on your statistical thinking

    Page 3

About This Worksheet

Free in Kuraplan

Sign up free, grab the PDF, and customize it for your class.

Print-Ready

Formatted for standard paper. Clean layout, easy to read.

AI-Generated

Created with Kuraplan's AI, designed for real classroom use.

For Teachers & Parents

Use in classrooms, for homework, tutoring, or homeschool.

Need a custom version of this worksheet?

Kuraplan's AI generates custom worksheets in seconds — differentiated for every learner, aligned to your curriculum.

Generate Custom Worksheets — Free
No credit card Curriculum-aligned Under 60 seconds