Year 12 Statistics Answers
A free maths worksheet ready for your classroom. Open in Kuraplan to grab the print-ready PDF, customize it for your students, or generate a fresh version in seconds.
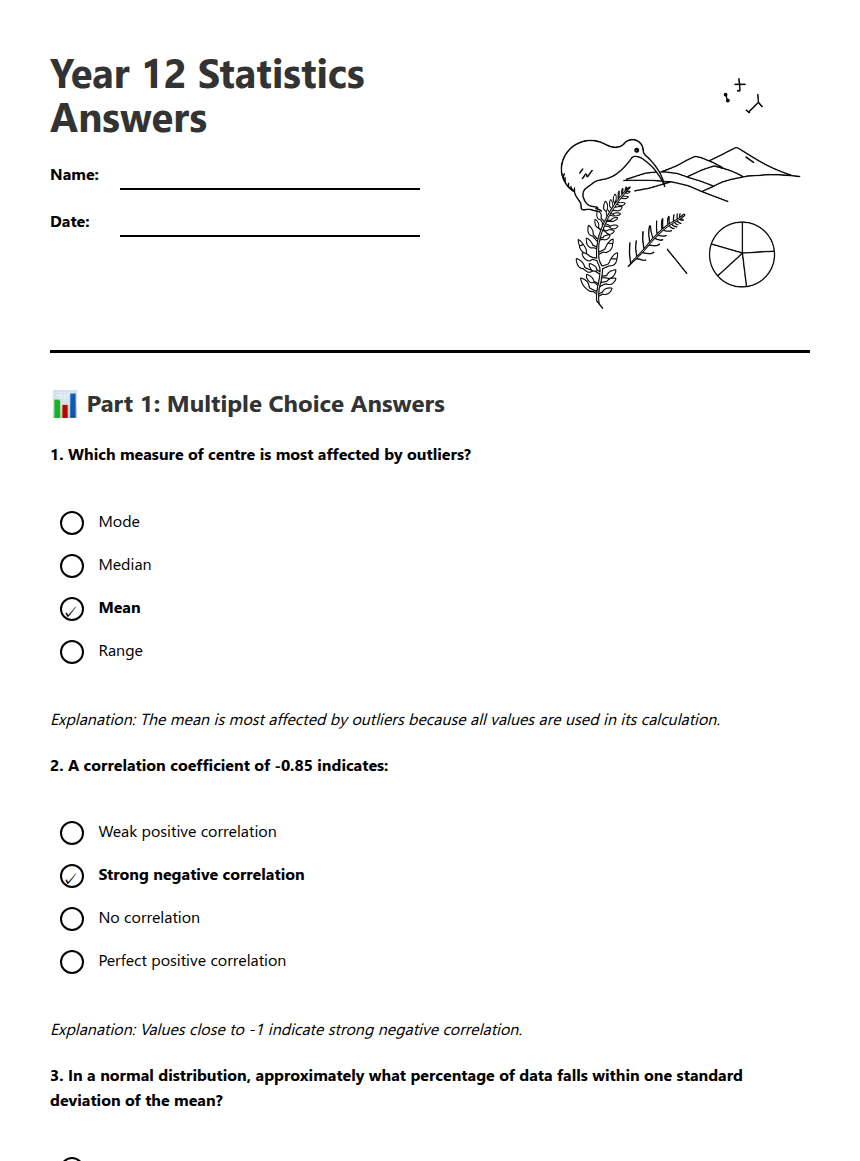
Year 12 Statistics Answers
📊 Part 1: Multiple Choice Answers
Explanation: The mean is most affected by outliers because all values are used in its calculation.
Explanation: Values close to -1 indicate strong negative correlation.
Explanation: The empirical rule states that 68% of data falls within 1 standard deviation.
Explanation: Stratified sampling ensures representation from different year levels.
📈 Part 2: Calculation Problems
ACHIEVED LEVEL ANSWER:
Ordered data: 12, 15, 15, 15, 18, 19, 20, 22
Mean = (12+15+15+15+18+19+20+22) ÷ 8 = 136 ÷ 8 = 17
Median = (15+18) ÷ 2 = 16.5
Mode = 15 (appears 3 times)
MERIT LEVEL ANSWER:
z = (x - μ) ÷ σ
z = (66 - 50) ÷ 8
z = 16 ÷ 8 = 2
Interpretation: The value 66 is 2 standard deviations above the mean.
EXCELLENCE LEVEL ANSWER:
This follows a binomial distribution: n = 200, p = 0.65
Expected value (μ) = np = 200 × 0.65 = 130
Standard deviation (σ) = √(np(1-p)) = √(200 × 0.65 × 0.35)
σ = √(45.5) = 6.75
Interpretation: We expect about 130 smartphone owners, with typical variation of ±6.75.
🎯 Part 3: Statistical Inference
EXCELLENCE LEVEL ANSWER:
Step 1: H₀: μ = 170cm, H₁: μ ≠ 170cm (two-tailed test)
Step 2: Test statistic: t = (x̄ - μ) ÷ (s/√n)
t = (172 - 170) ÷ (6/√25) = 2 ÷ 1.2 = 1.67
Step 3: df = 24, critical value = ±2.064 (α = 0.05)
Step 4: Since |1.67| < 2.064, we fail to reject H₀
Conclusion: There is insufficient evidence to reject the claim that the average height is 170cm.
MERIT/EXCELLENCE LEVEL ANSWER:
Type I Error: Rejecting the null hypothesis when it is actually true. The probability of this occurring is α (significance level). Also called a "false positive".
Type II Error: Failing to reject the null hypothesis when it is actually false. The probability of this occurring is β. Also called a "false negative".
Example: In medical testing, Type I would be diagnosing a healthy person as sick, while Type II would be failing to diagnose a sick person.
EXCELLENCE LEVEL ANSWER:
Interpretation: We are confident that the true population mean weight of apples lies between 145g and 155g.
Confidence Level: If this procedure were repeated many times with different samples, the stated percentage of intervals would contain the true population mean.
Note: The confidence level refers to the method, not this specific interval. We cannot say there's a certain probability that μ lies in this interval.
About This Worksheet
Free in Kuraplan
Sign up free, grab the PDF, and customize it for your class.
Print-Ready
Formatted for standard paper. Clean layout, easy to read.
AI-Generated
Created with Kuraplan's AI, designed for real classroom use.
For Teachers & Parents
Use in classrooms, for homework, tutoring, or homeschool.
Need a custom version of this worksheet?
Kuraplan's AI generates custom worksheets in seconds — differentiated for every learner, aligned to your curriculum.
Generate Custom Worksheets — Free






