Comparing Two Distributions
A free mathematics worksheet ready for your classroom. Open in Kuraplan to grab the print-ready PDF, customize it for your students, or generate a fresh version in seconds.
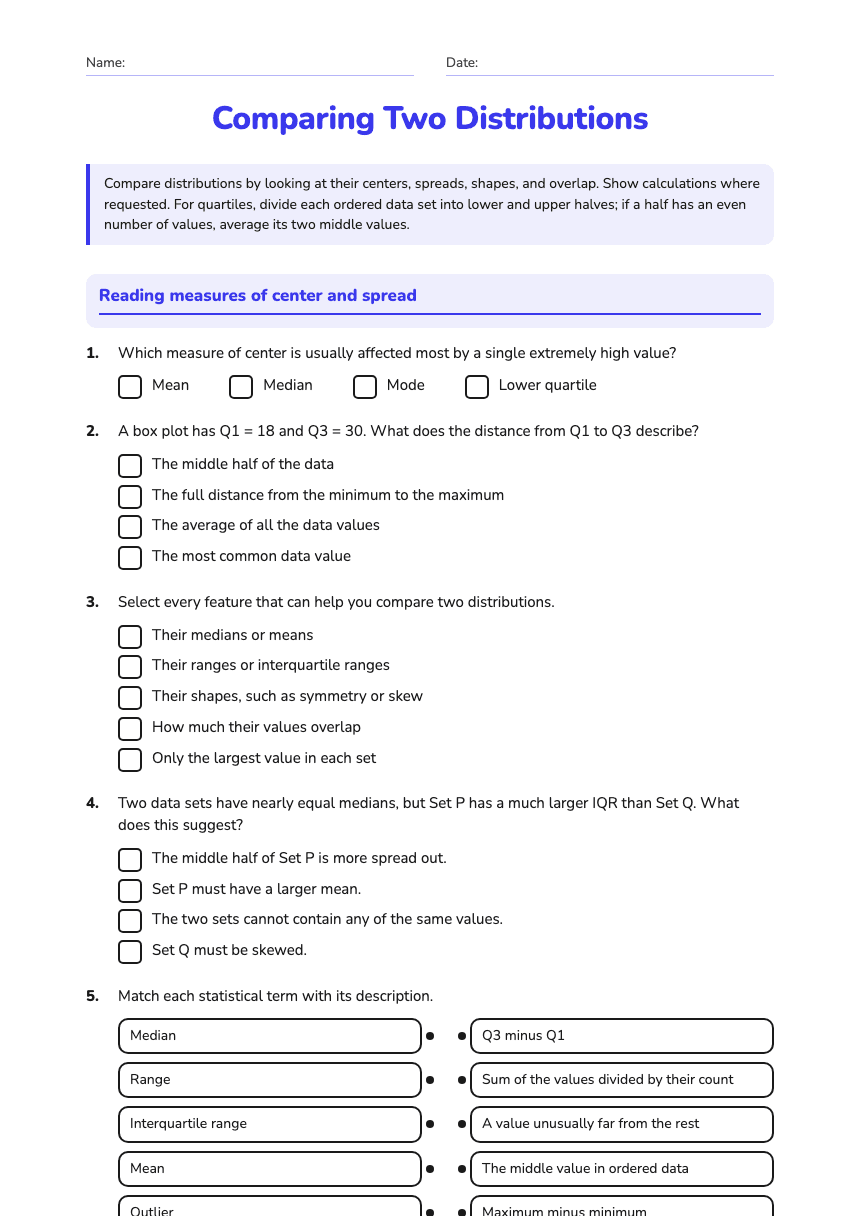
Comparing Two Distributions
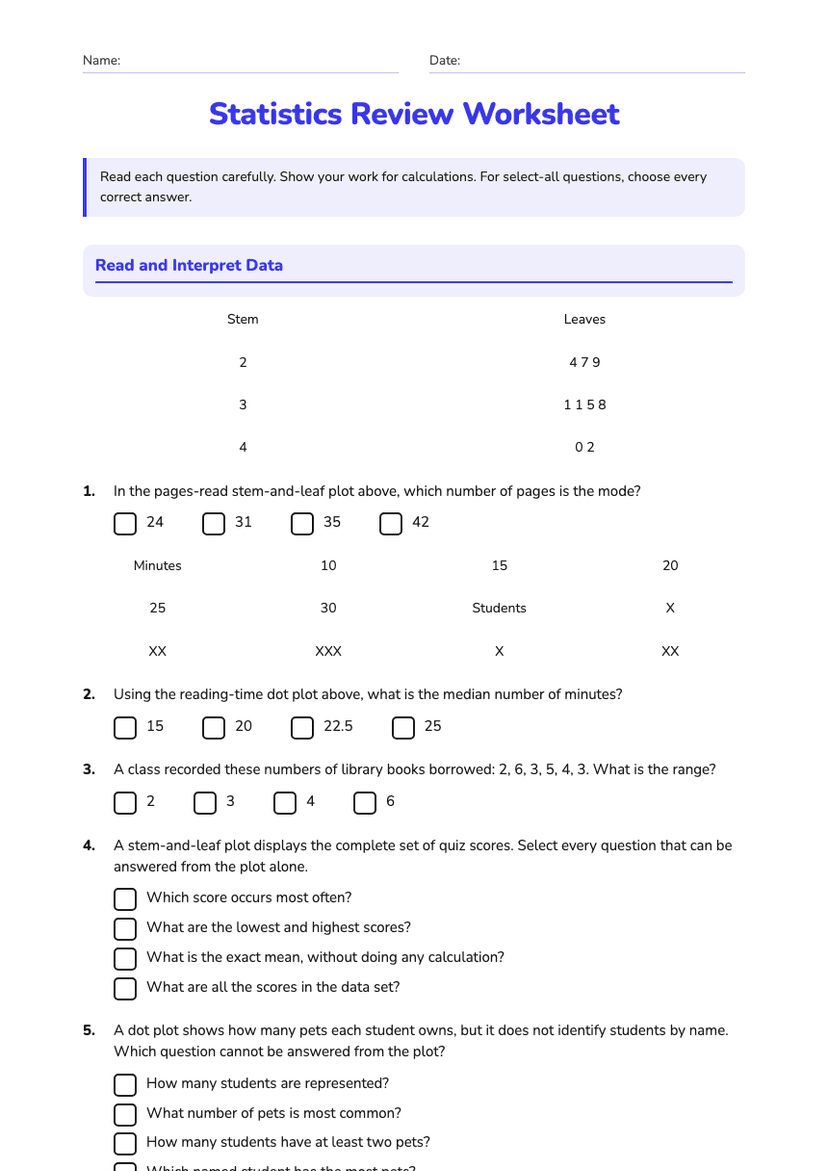
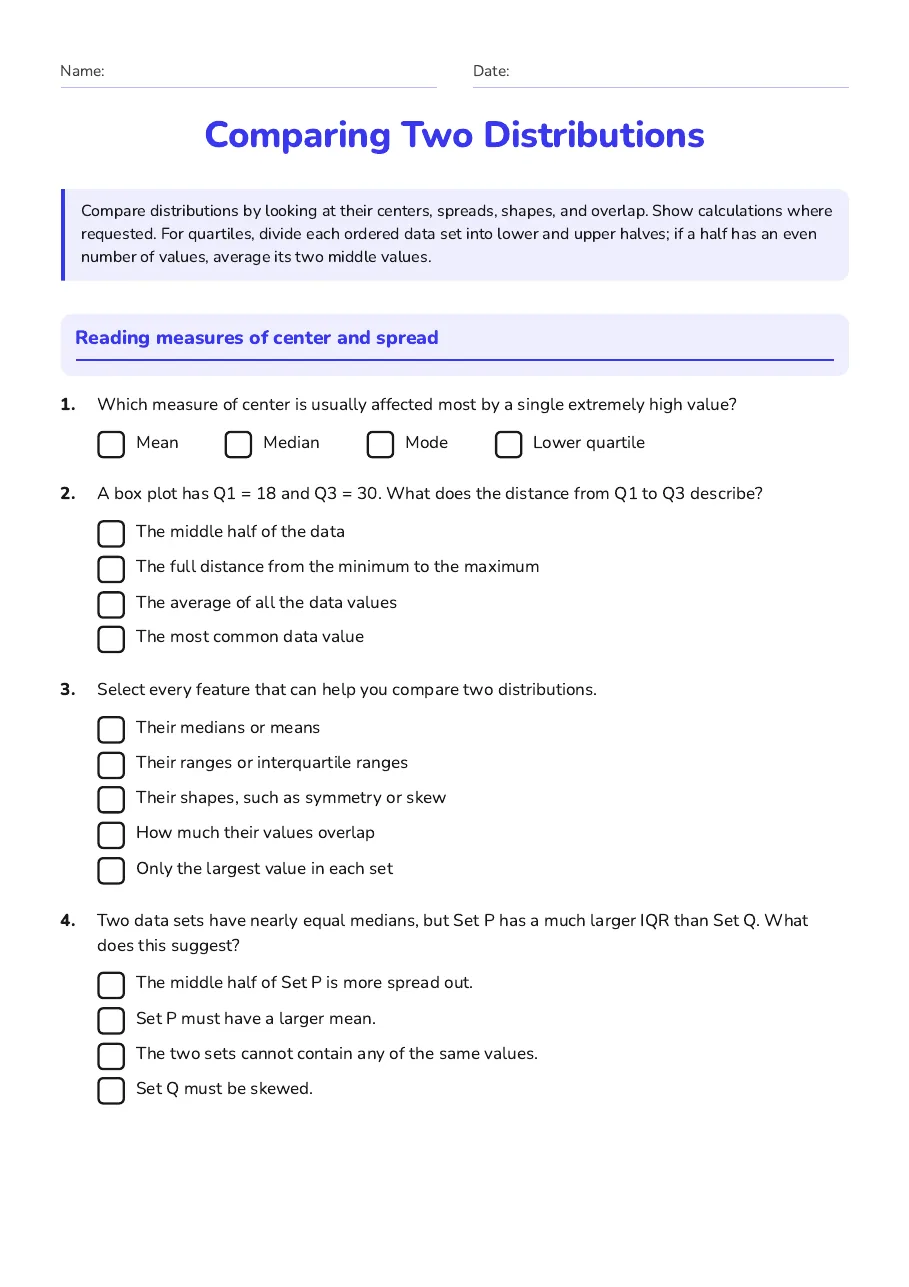
Reading measures of center and spread
- Mean
- Median
- Mode
- Lower quartile
- The middle half of the data
- The full distance from the minimum to the maximum
- The average of all the data values
- The most common data value
- Their medians or means
- Their ranges or interquartile ranges
- Their shapes, such as symmetry or skew
- How much their values overlap
- Only the largest value in each set
- The middle half of Set P is more spread out.
- Set P must have a larger mean.
- The two sets cannot contain any of the same values.
- Set Q must be skewed.
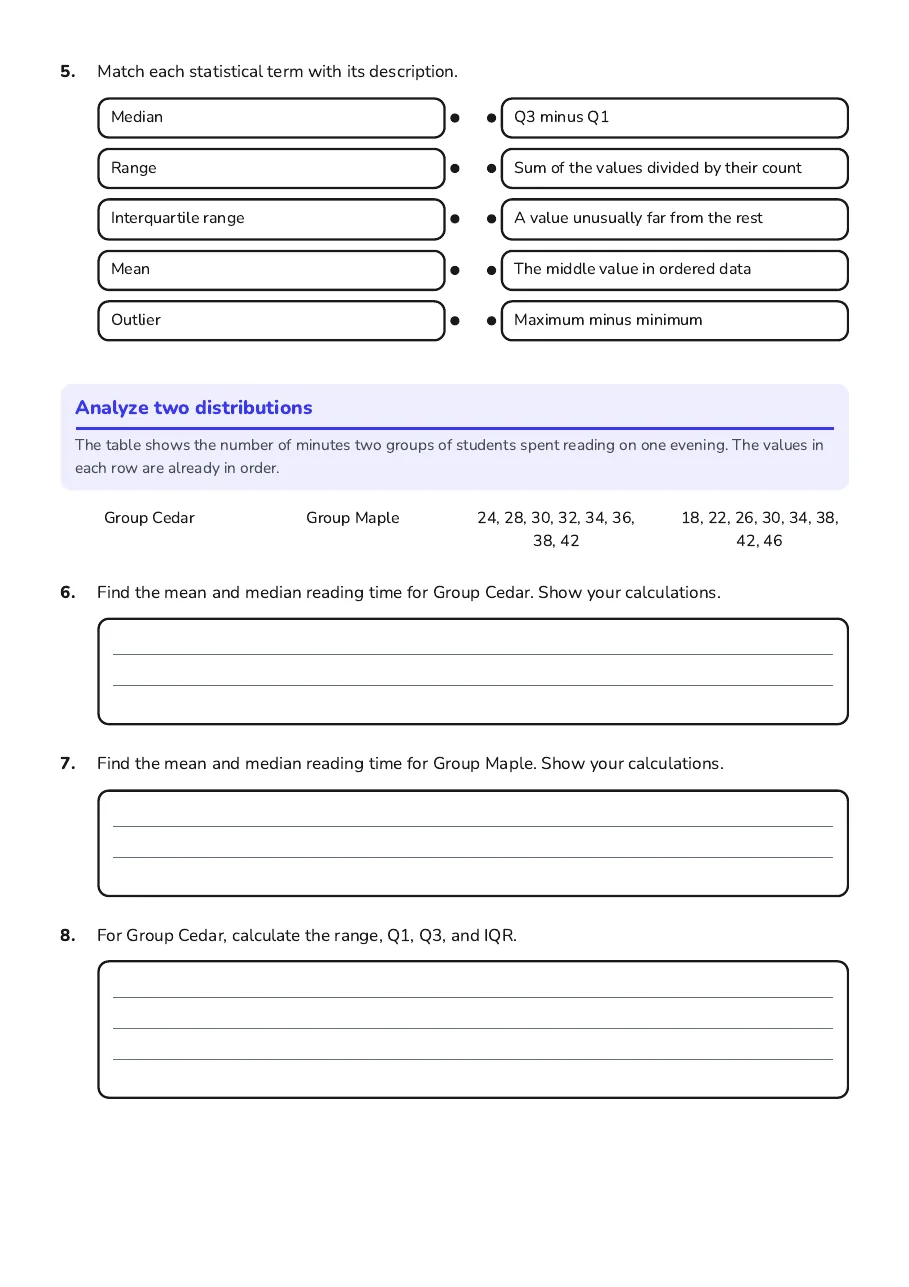
- Median
- Range
- Interquartile range
- Mean
- Outlier
- Q3 minus Q1
- Sum of the values divided by their count
- A value unusually far from the rest
- The middle value in ordered data
- Maximum minus minimum
Analyze two distributions
The table shows the number of minutes two groups of students spent reading on one evening. The values in each row are already in order.
Group Cedar
Group Maple
24, 28, 30, 32, 34, 36, 38, 42
18, 22, 26, 30, 34, 38, 42, 46
3 printable pages
Page 1
Page 2
Page 3
About This Worksheet
Free in Kuraplan
Sign up free, grab the PDF, and customize it for your class.
Print-Ready
Formatted for standard paper. Clean layout, easy to read.
AI-Generated
Created with Kuraplan's AI, designed for real classroom use.
For Teachers & Parents
Use in classrooms, for homework, tutoring, or homeschool.
Need a custom version of this worksheet?
Kuraplan's AI generates custom worksheets in seconds — differentiated for every learner, aligned to your curriculum.
Generate Custom Worksheets — Free