MathematicsFreePrintable

Linear Inequalities Graphing

A free mathematics worksheet ready for your classroom. Open in Kuraplan to grab the print-ready PDF, customize it for your students, or generate a fresh version in seconds.
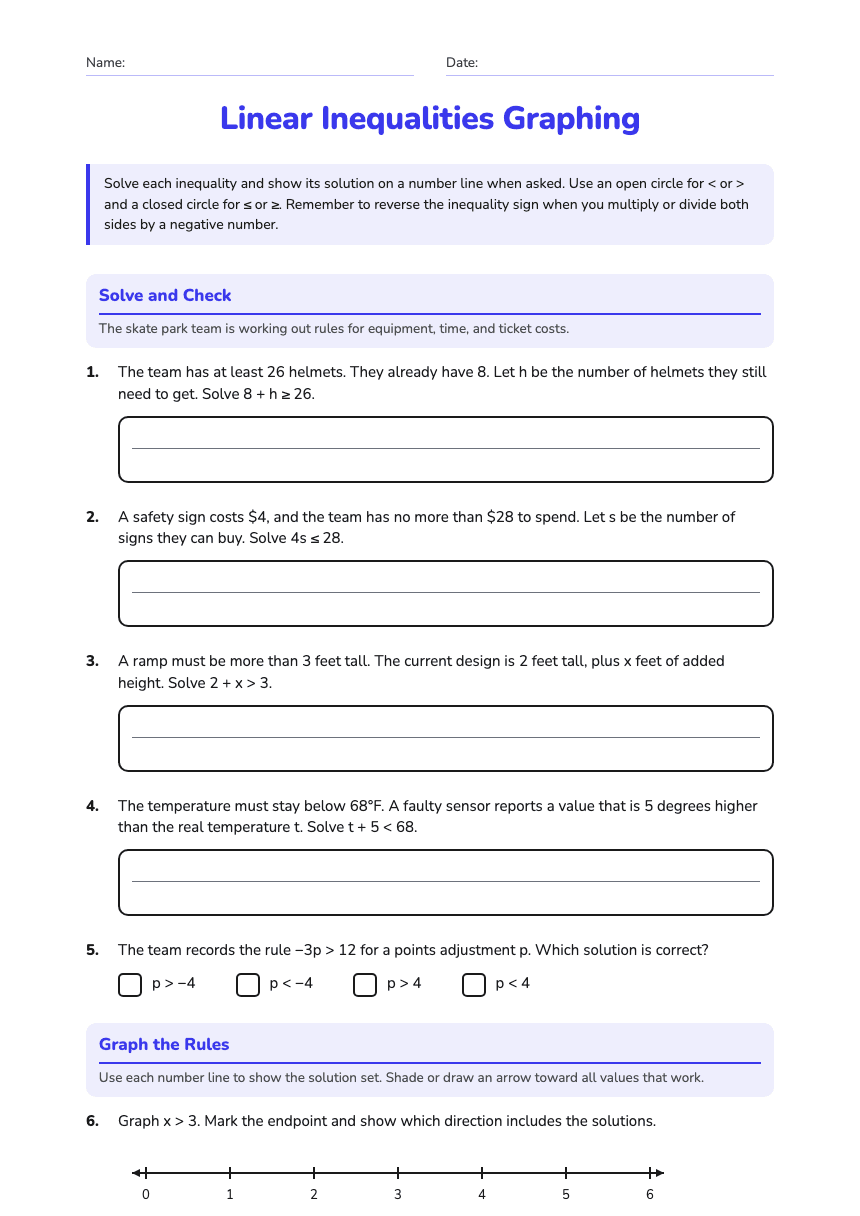
Linear Inequalities Graphing worksheet preview
Name:Date:

Linear Inequalities Graphing

Solve each inequality and show its solution on a number line when asked. Use an open circle for < or > and a closed circle for ≤ or ≥. Remember to reverse the inequality sign when you multiply or divide both sides by a negative number.

Solve and Check

The skate park team is working out rules for equipment, time, and ticket costs.

1.The team has at least 26 helmets. They already have 8. Let h be the number of helmets they still need to get. Solve 8 + h ≥ 26.
2.A safety sign costs $4, and the team has no more than $28 to spend. Let s be the number of signs they can buy. Solve 4s ≤ 28.
3.A ramp must be more than 3 feet tall. The current design is 2 feet tall, plus x feet of added height. Solve 2 + x > 3.
4.The temperature must stay below 68°F. A faulty sensor reports a value that is 5 degrees higher than the real temperature t. Solve t + 5 < 68.
5.The team records the rule −3p > 12 for a points adjustment p. Which solution is correct?
  • p > −4
  • p < −4
  • p > 4
  • p < 4

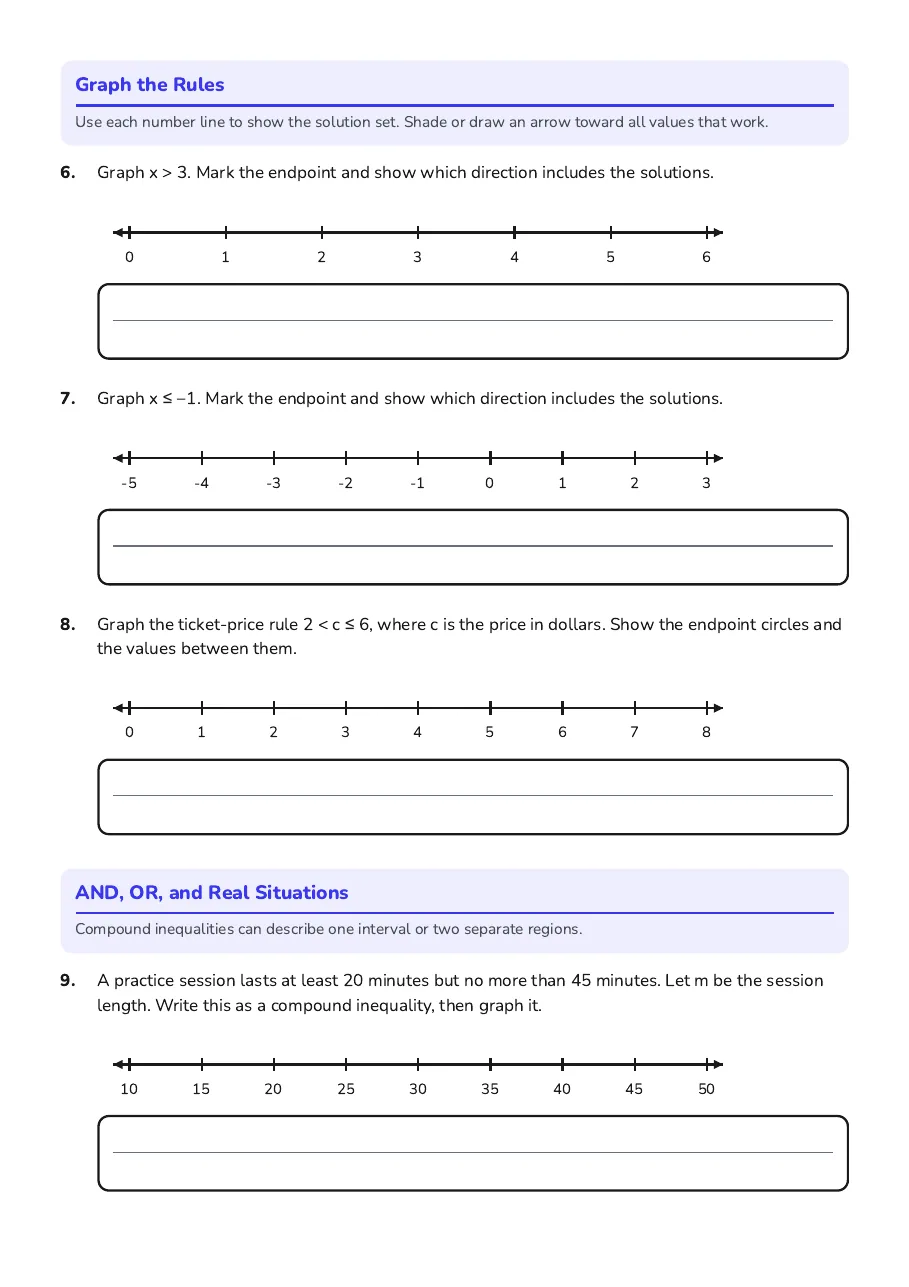
Graph the Rules

Use each number line to show the solution set. Shade or draw an arrow toward all values that work.

6.Graph x > 3. Mark the endpoint and show which direction includes the solutions.
0123456
7.Graph x ≤ −1. Mark the endpoint and show which direction includes the solutions.
-5-4-3-2-10123
8.Graph the ticket-price rule 2 < c ≤ 6, where c is the price in dollars. Show the endpoint circles and the values between them.
012345678

AND, OR, and Real Situations

Compound inequalities can describe one interval or two separate regions.

9.A practice session lasts at least 20 minutes but no more than 45 minutes. Let m be the session length. Write this as a compound inequality, then graph it.
101520253035404550
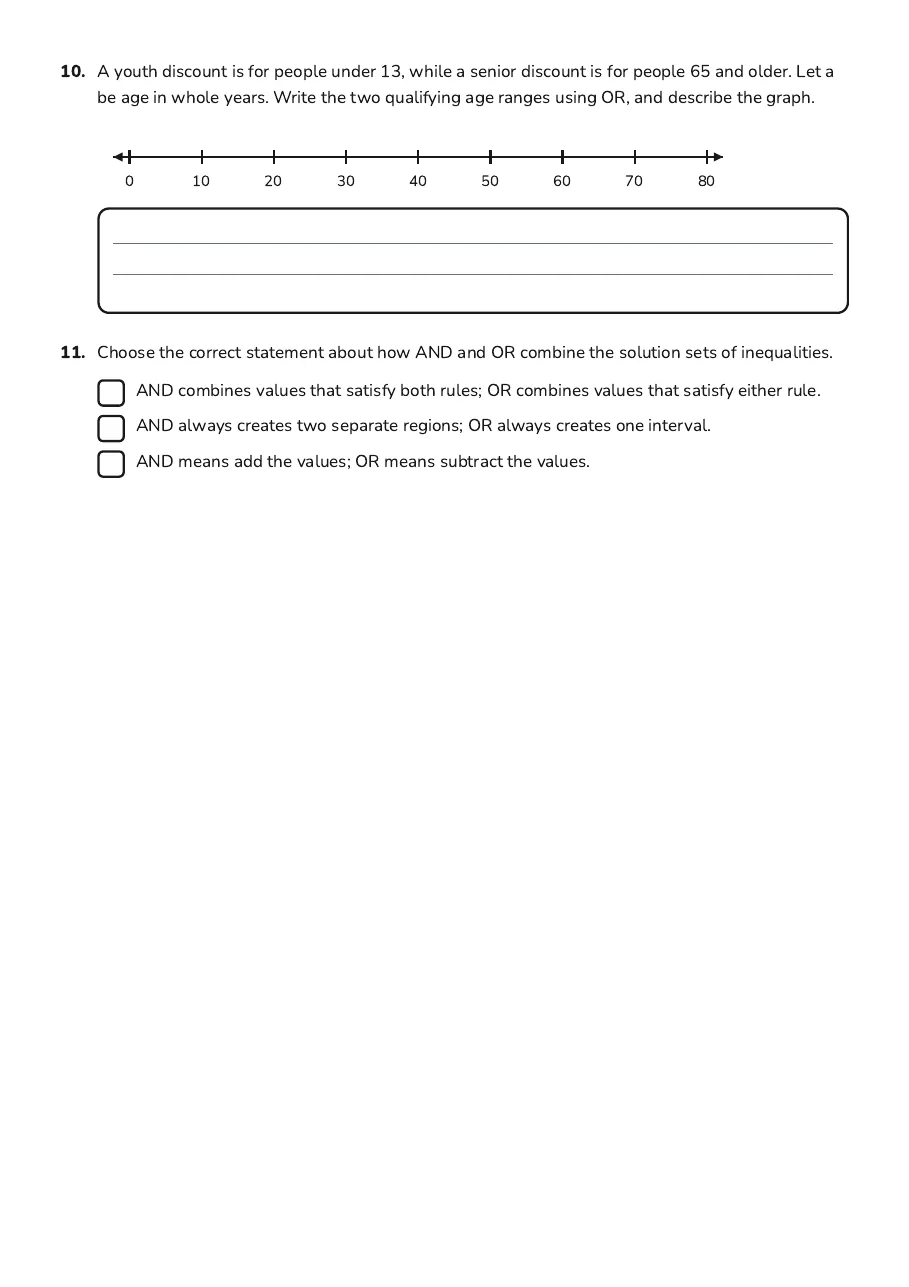
10.A youth discount is for people under 13, while a senior discount is for people 65 and older. Let a be age in whole years. Write the two qualifying age ranges using OR, and describe the graph.
01020304050607080
11.Choose the correct statement about how AND and OR combine the solution sets of inequalities.
  • AND combines values that satisfy both rules; OR combines values that satisfy either rule.
  • AND always creates two separate regions; OR always creates one interval.
  • AND means add the values; OR means subtract the values.

3 printable pages
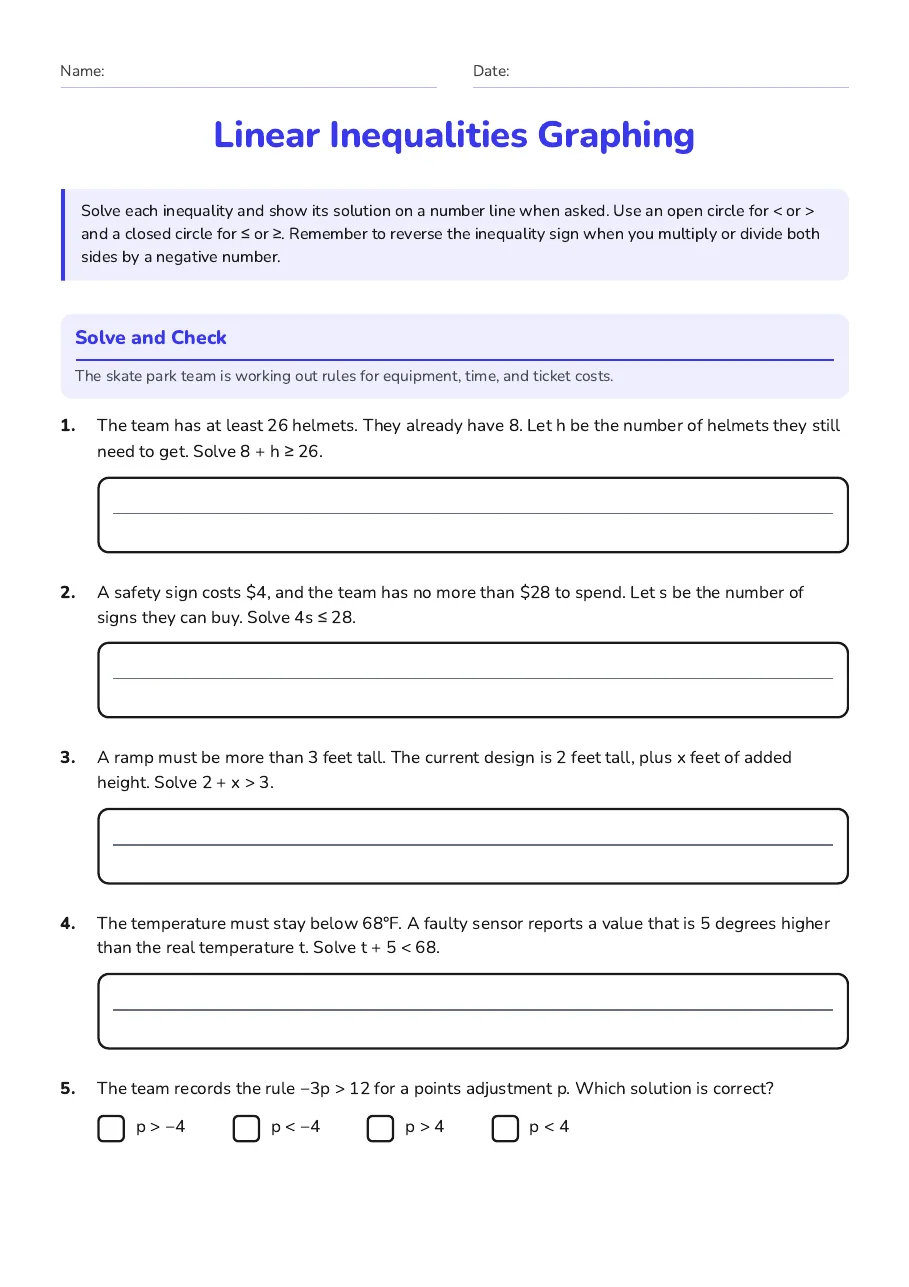
  • Linear Inequalities Graphing, page 1 of 3: Solve and Check

    Page 1

  • Linear Inequalities Graphing, page 2 of 3: Graph the Rules, AND, OR, and Real Situations

    Page 2

  • Linear Inequalities Graphing, page 3 of 3: 10. A youth discount is for people under 13, while a senior discount is for people 65 and…

    Page 3

About This Worksheet

Free in Kuraplan

Sign up free, grab the PDF, and customize it for your class.

Print-Ready

Formatted for standard paper. Clean layout, easy to read.

AI-Generated

Created with Kuraplan's AI, designed for real classroom use.

For Teachers & Parents

Use in classrooms, for homework, tutoring, or homeschool.

Need a custom version of this worksheet?

Kuraplan's AI generates custom worksheets in seconds — differentiated for every learner, aligned to your curriculum.

Generate Custom Worksheets — Free
No credit card Curriculum-aligned Under 60 seconds