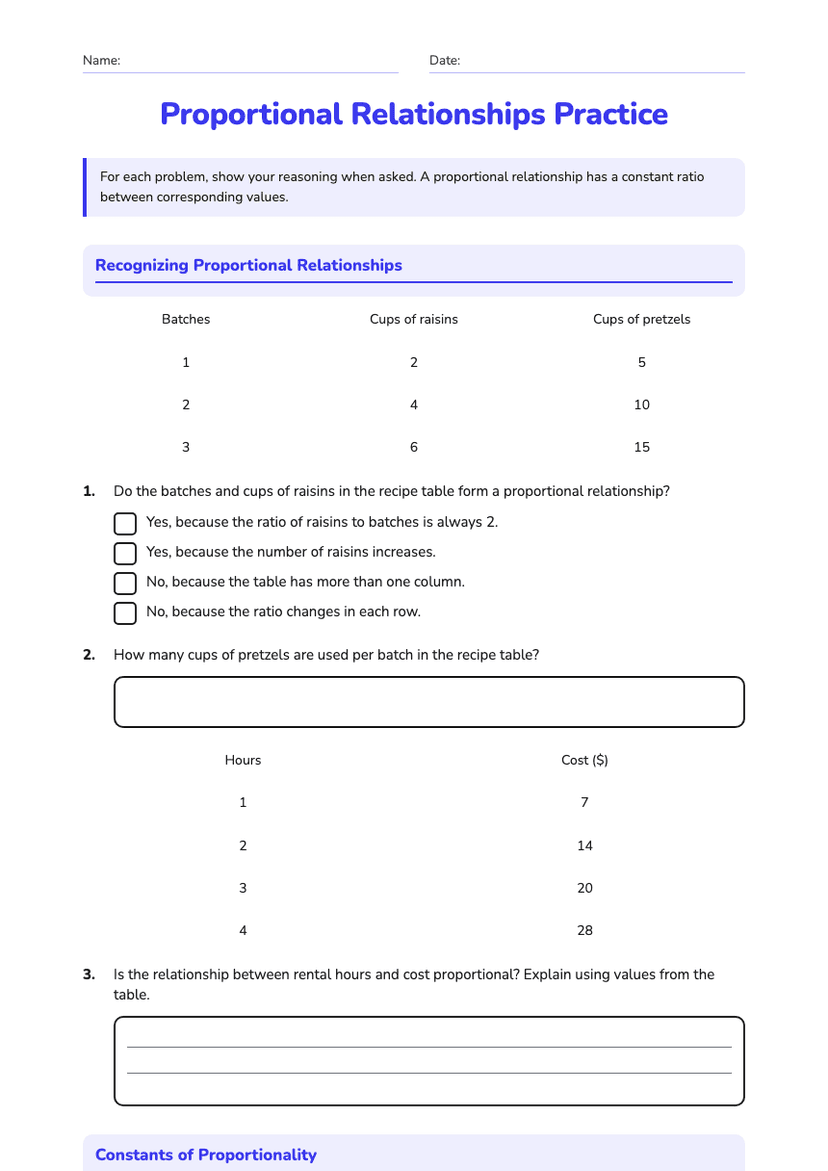
Proportional Relationships Check
A free mathematics worksheet ready for your classroom. Open in Kuraplan to grab the print-ready PDF, customize it for your students, or generate a fresh version in seconds.
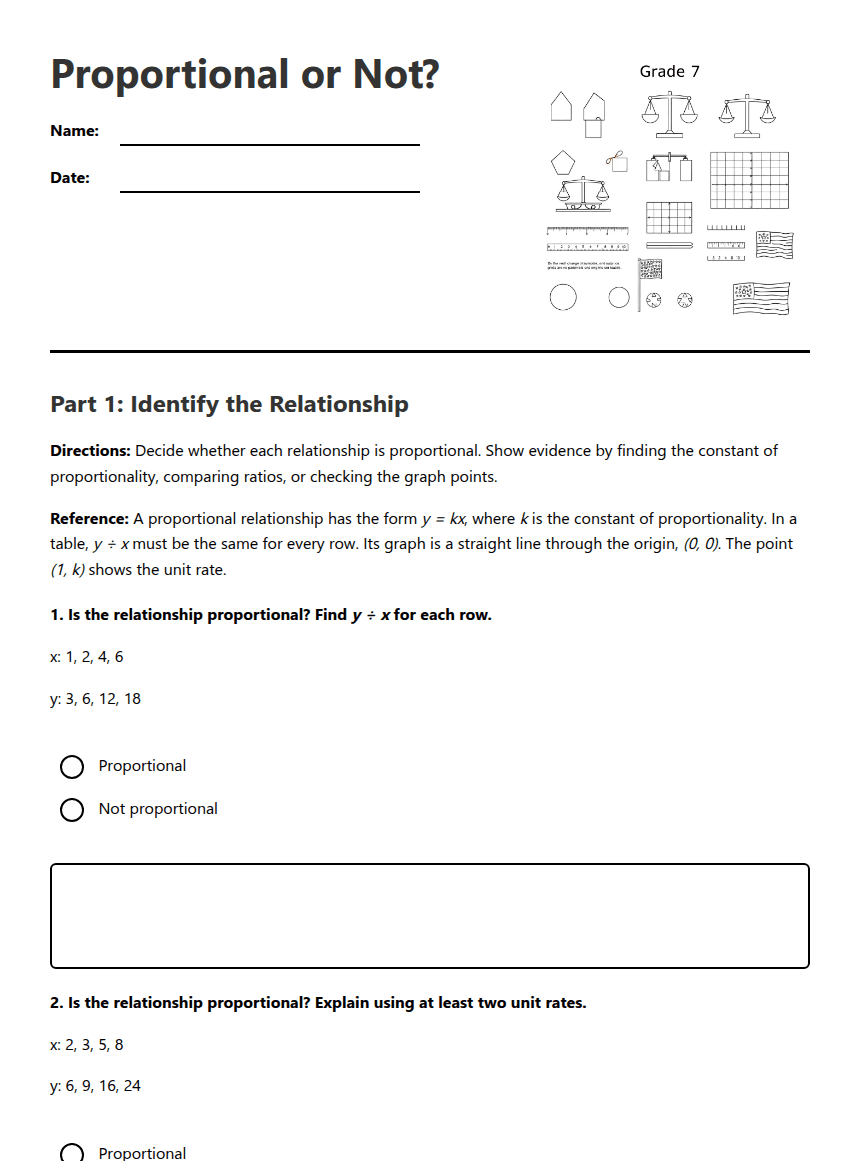
Proportional or Not?
Part 1: Identify the Relationship
Directions: Decide whether each relationship is proportional. Show evidence by finding the constant of proportionality, comparing ratios, or checking the graph points.
Reference: A proportional relationship has the form y = kx, where k is the constant of proportionality. In a table, y ÷ x must be the same for every row. Its graph is a straight line through the origin, (0, 0). The point (1, k) shows the unit rate.
x: 1, 2, 4, 6
y: 3, 6, 12, 18
x: 2, 3, 5, 8
y: 6, 9, 16, 24
x: 1, 3, 5, 7
y: 4, 12, ______, 28
Part 2: Situations and Graph Evidence
Answer Key
1. Proportional. The unit rate is 3 in every row: 3 ÷ 1 = 3, 6 ÷ 2 = 3, 12 ÷ 4 = 3, and 18 ÷ 6 = 3. Thus, y = 3x.
2. Not proportional. For example, 6 ÷ 2 = 3, but 16 ÷ 5 = 3.2. The unit rates are not constant.
3. The missing value is 20. The constant of proportionality is 4 because y = 4x.
4. Yes. It is already in the form y = kx, and k = 5.
5. Not proportional. The equation has a starting value of 2, so its graph would not pass through the origin.
6. Proportional. Both unit rates are $2 per notebook: $6 ÷ 3 = $2 and $10 ÷ 5 = $2.
7. Yes. The points form a straight line through (0, 0), and the unit rate is 3. The point (1, 3) means 1 unit of the input corresponds to 3 units of the output.
8. No. Although the points may form a straight line, the line does not pass through the origin, so the relationship is not proportional.
9. y = 4x. Yes, it is proportional because the cost is a constant $4 per mile and there is no starting fee.
10. Recipe A is proportional because 5 ÷ 2 = 2.5 and 10 ÷ 4 = 2.5. Recipe B is not proportional because 11 ÷ 4 = 2.75.
Challenge 1. Answers may vary. Example: proportional: (1, 4), (2, 8), (3, 12); nonproportional: (1, 4), (2, 8), (3, 13). The first has a constant ratio of 4; the second does not.
Challenge 2. Example: y = 2.5x, with points (0, 0) and (4, 10). The point (1, 2.5) represents a unit rate of 2.5 output units for every 1 input unit.
Exit Ticket: Not proportional. The first two rates are $4 per mile, but $11 ÷ 3 is not $4. If proportional, (1, 4) would mean 1 mile costs $4.
About This Worksheet
Free in Kuraplan
Sign up free, grab the PDF, and customize it for your class.
Print-Ready
Formatted for standard paper. Clean layout, easy to read.
AI-Generated
Created with Kuraplan's AI, designed for real classroom use.
For Teachers & Parents
Use in classrooms, for homework, tutoring, or homeschool.
Need a custom version of this worksheet?
Kuraplan's AI generates custom worksheets in seconds — differentiated for every learner, aligned to your curriculum.
Generate Custom Worksheets — FreeMore Mathematics Worksheets
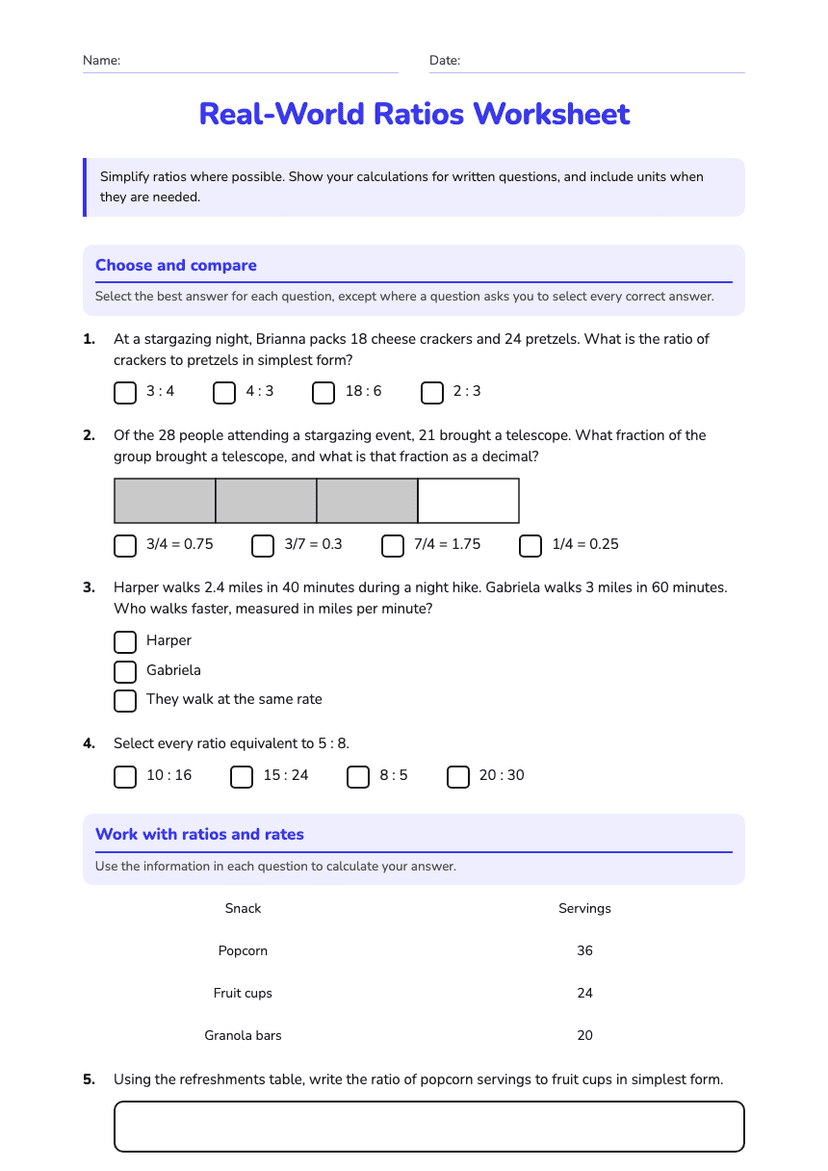
Real-World Ratios Worksheet
Free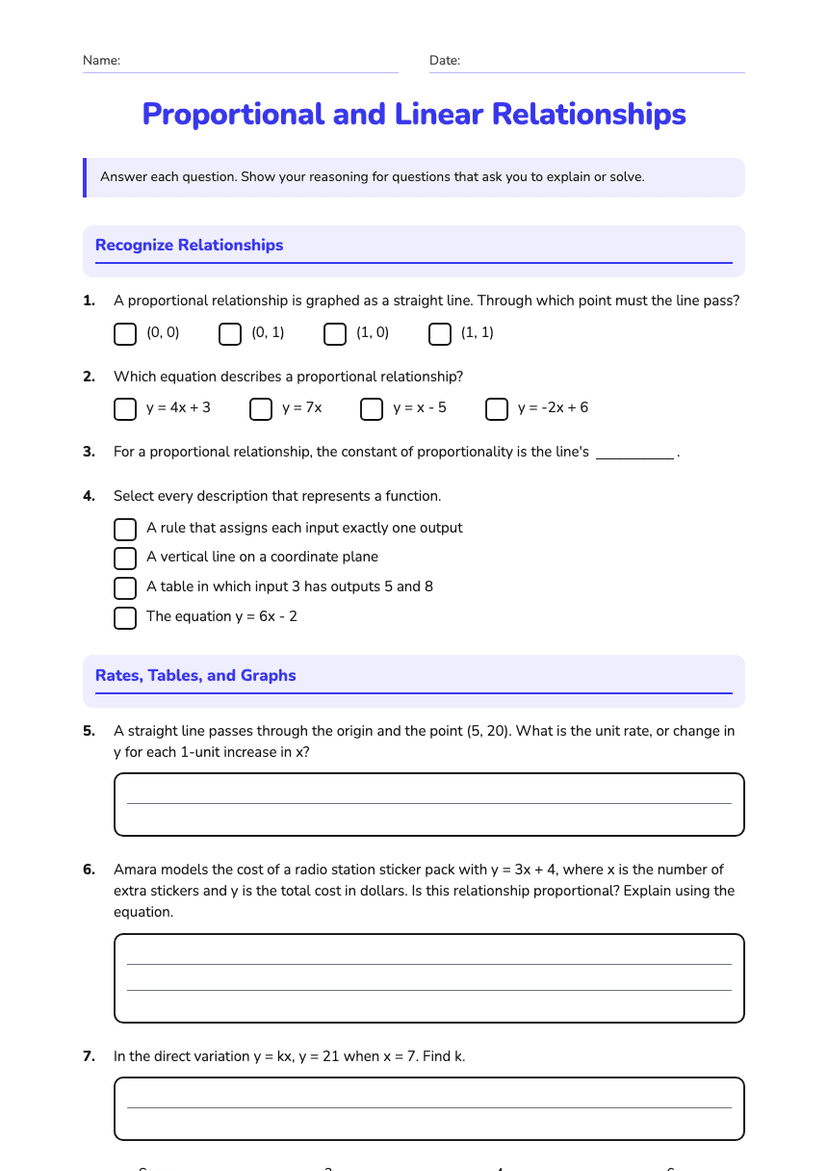
Proportional and Linear Relationships
Free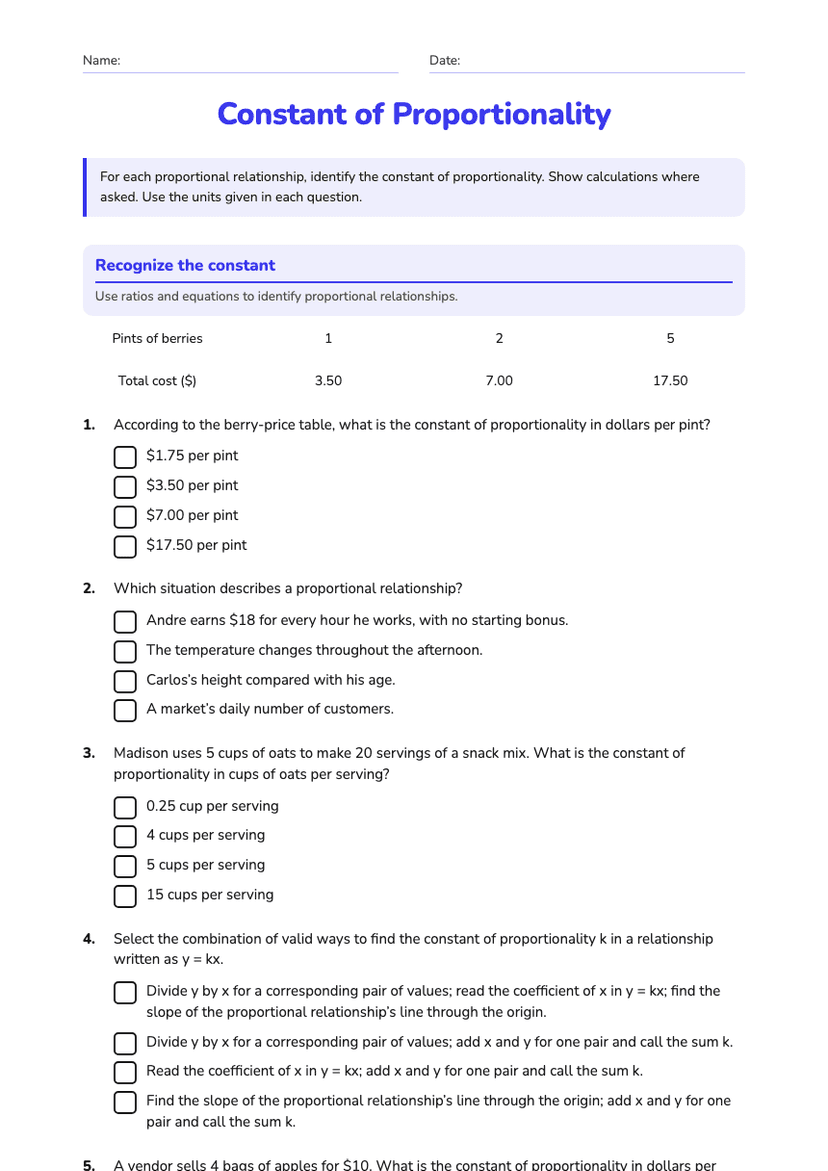
Constant of Proportionality
Free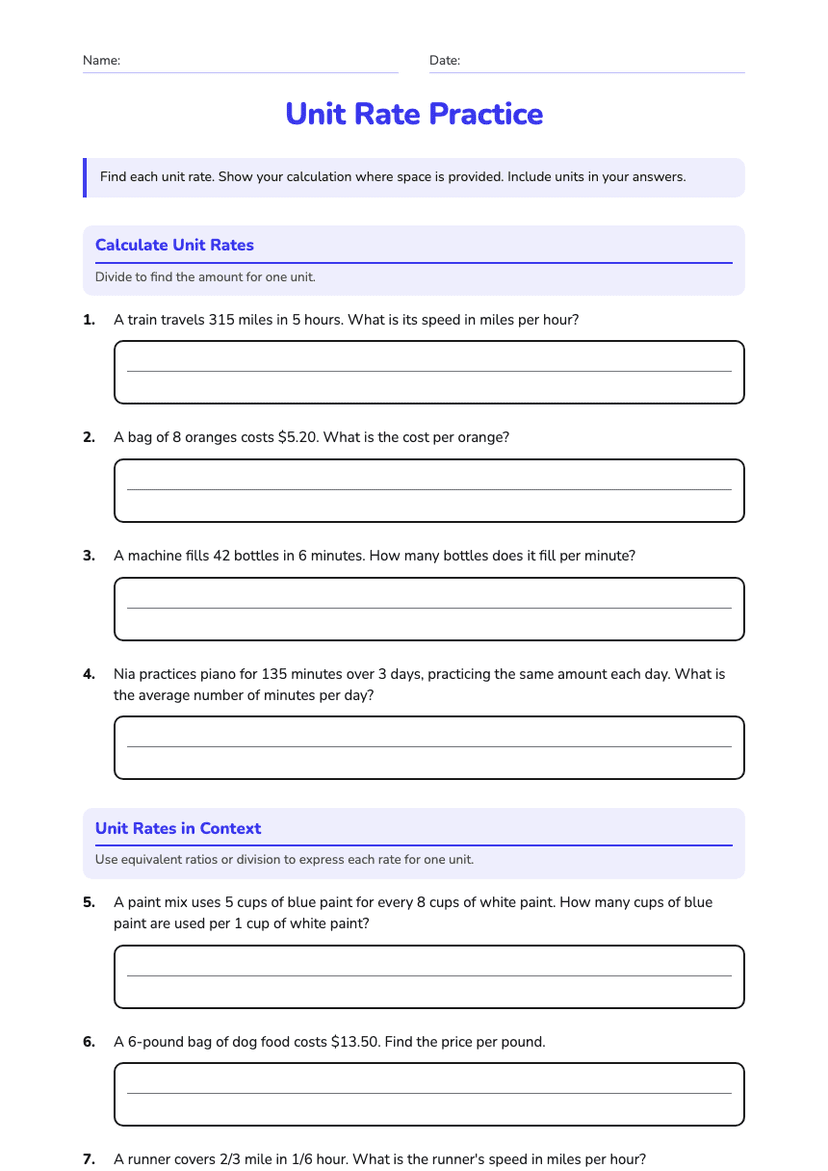
Unit Rate Practice
Free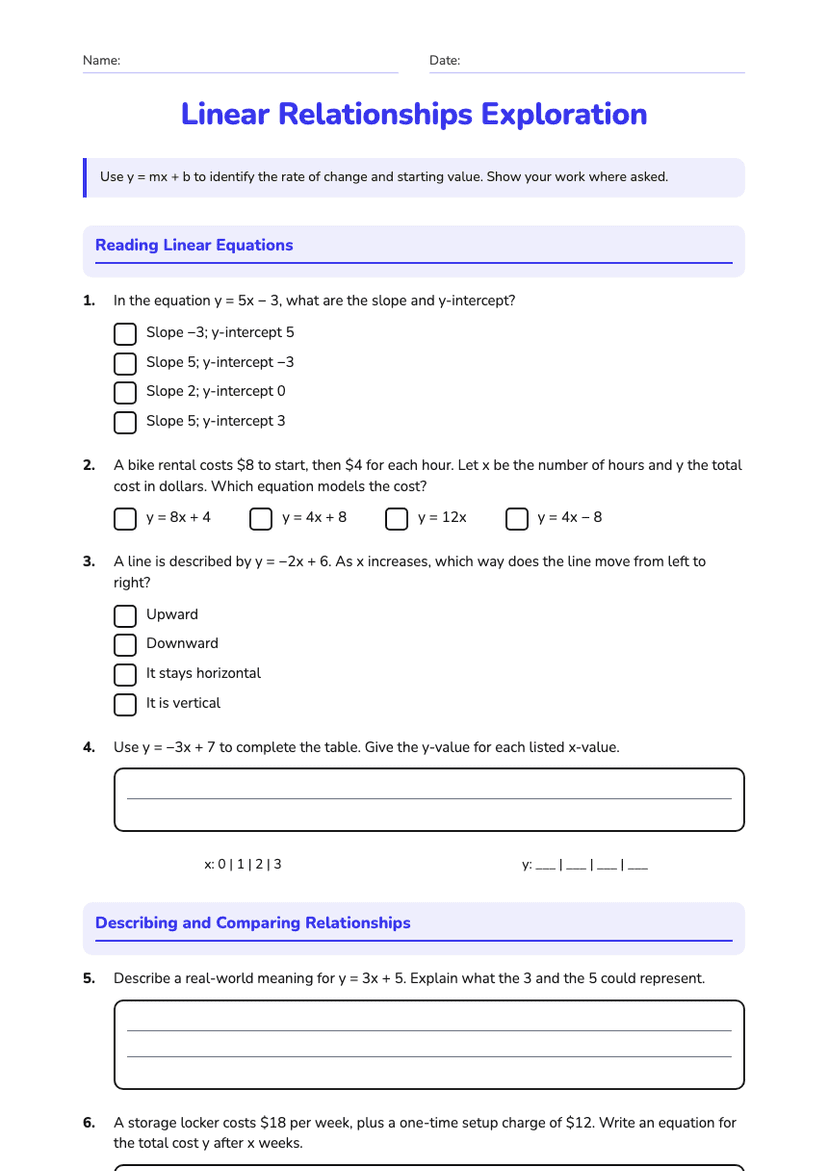
Linear Relationships Exploration
Free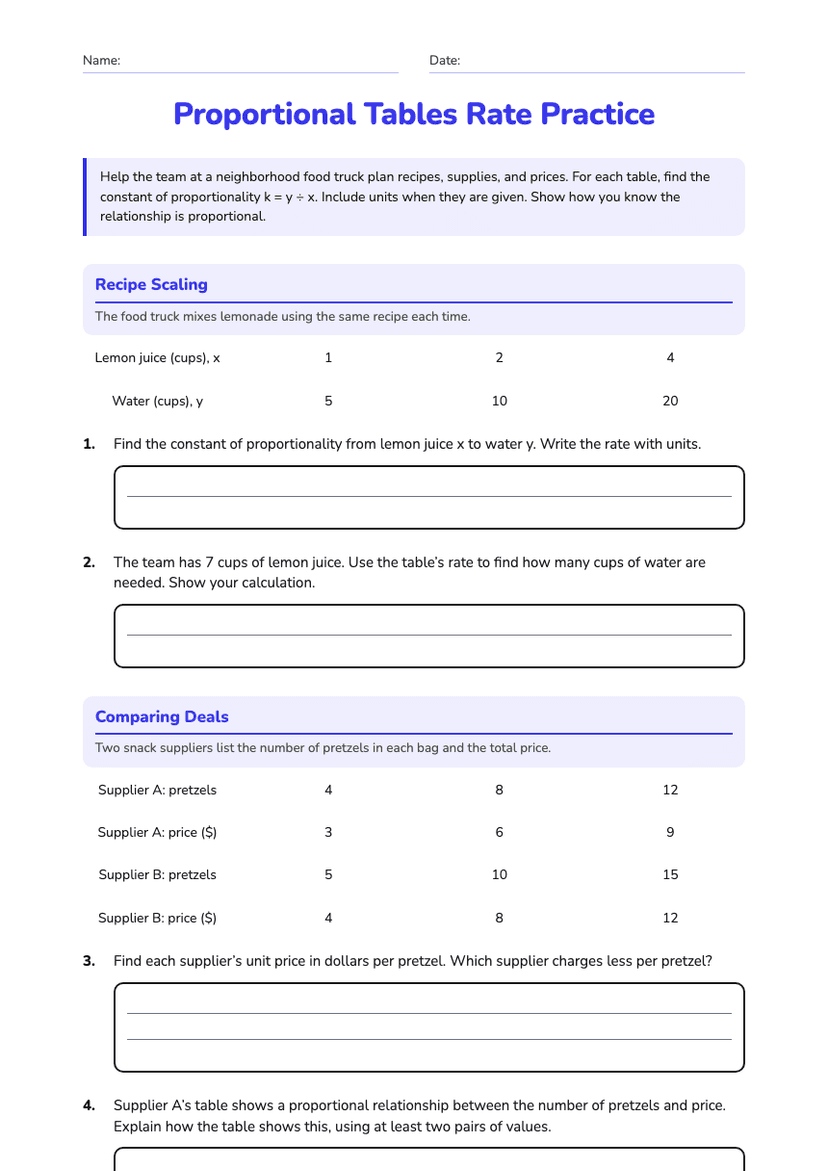
Proportional Tables Rate Practice
Free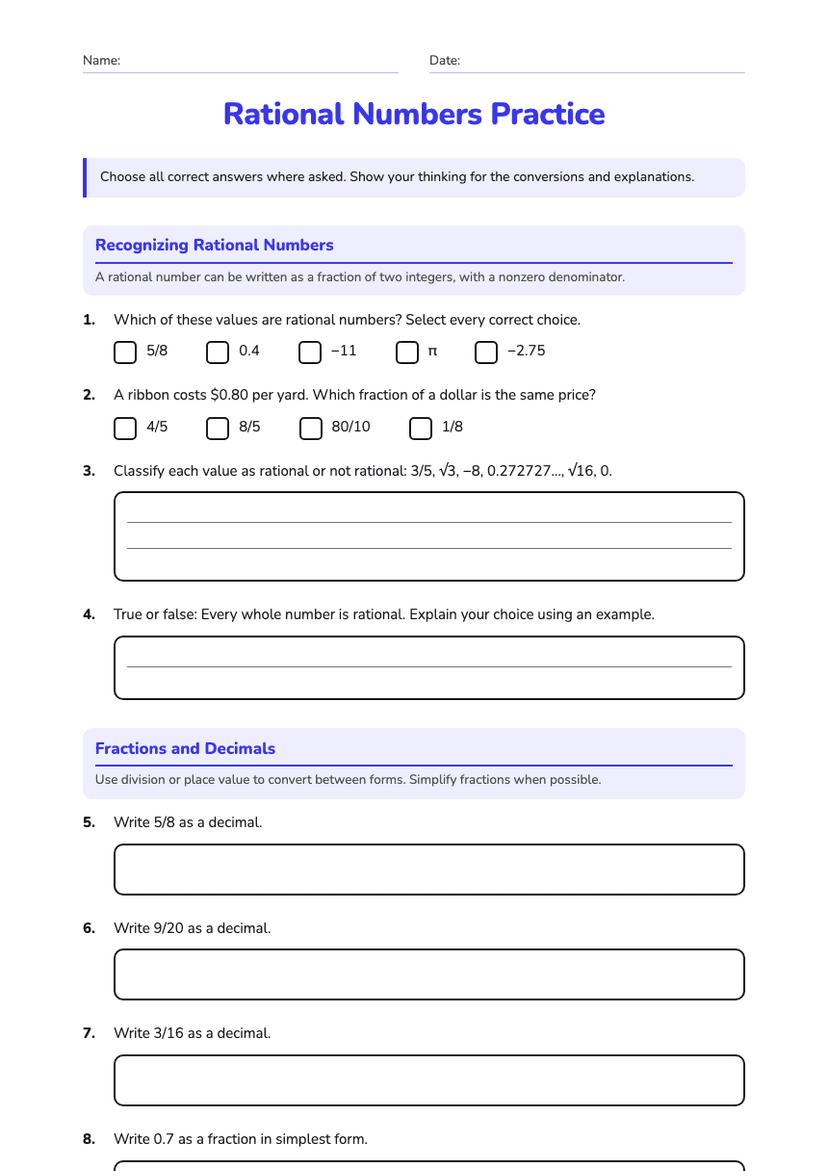
Rational Numbers Practice
Free