MathematicsFreePrintable
Proportional Relationships Practice
A free mathematics worksheet ready for your classroom. Open in Kuraplan to grab the print-ready PDF, customize it for your students, or generate a fresh version in seconds.
Name:Date:
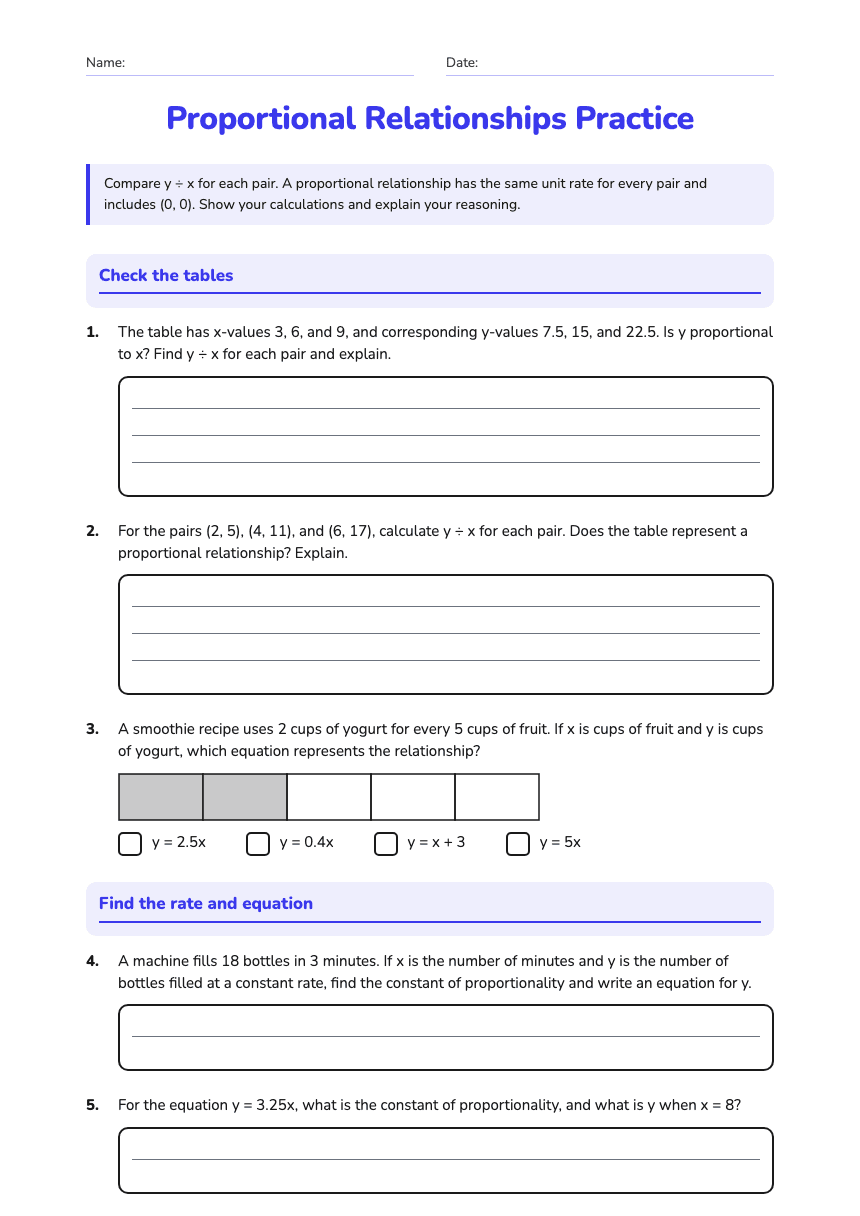
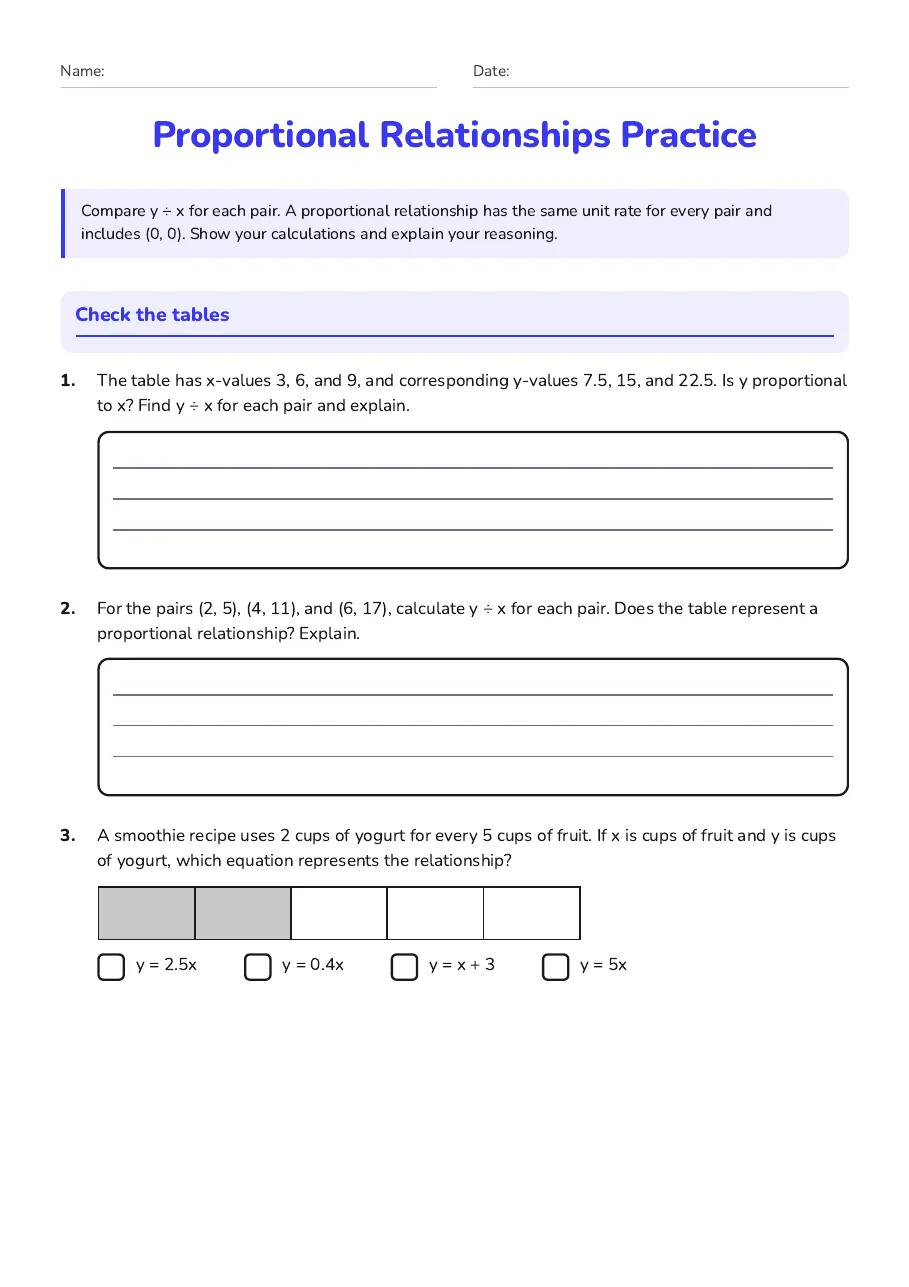
Proportional Relationships Practice
Compare y ÷ x for each pair. A proportional relationship has the same unit rate for every pair and includes (0, 0). Show your calculations and explain your reasoning.
Check the tables
1.The table has x-values 3, 6, and 9, and corresponding y-values 7.5, 15, and 22.5. Is y proportional to x? Find y ÷ x for each pair and explain.
2.For the pairs (2, 5), (4, 11), and (6, 17), calculate y ÷ x for each pair. Does the table represent a proportional relationship? Explain.
3.A smoothie recipe uses 2 cups of yogurt for every 5 cups of fruit. If x is cups of fruit and y is cups of yogurt, which equation represents the relationship?
- y = 2.5x
- y = 0.4x
- y = x + 3
- y = 5x
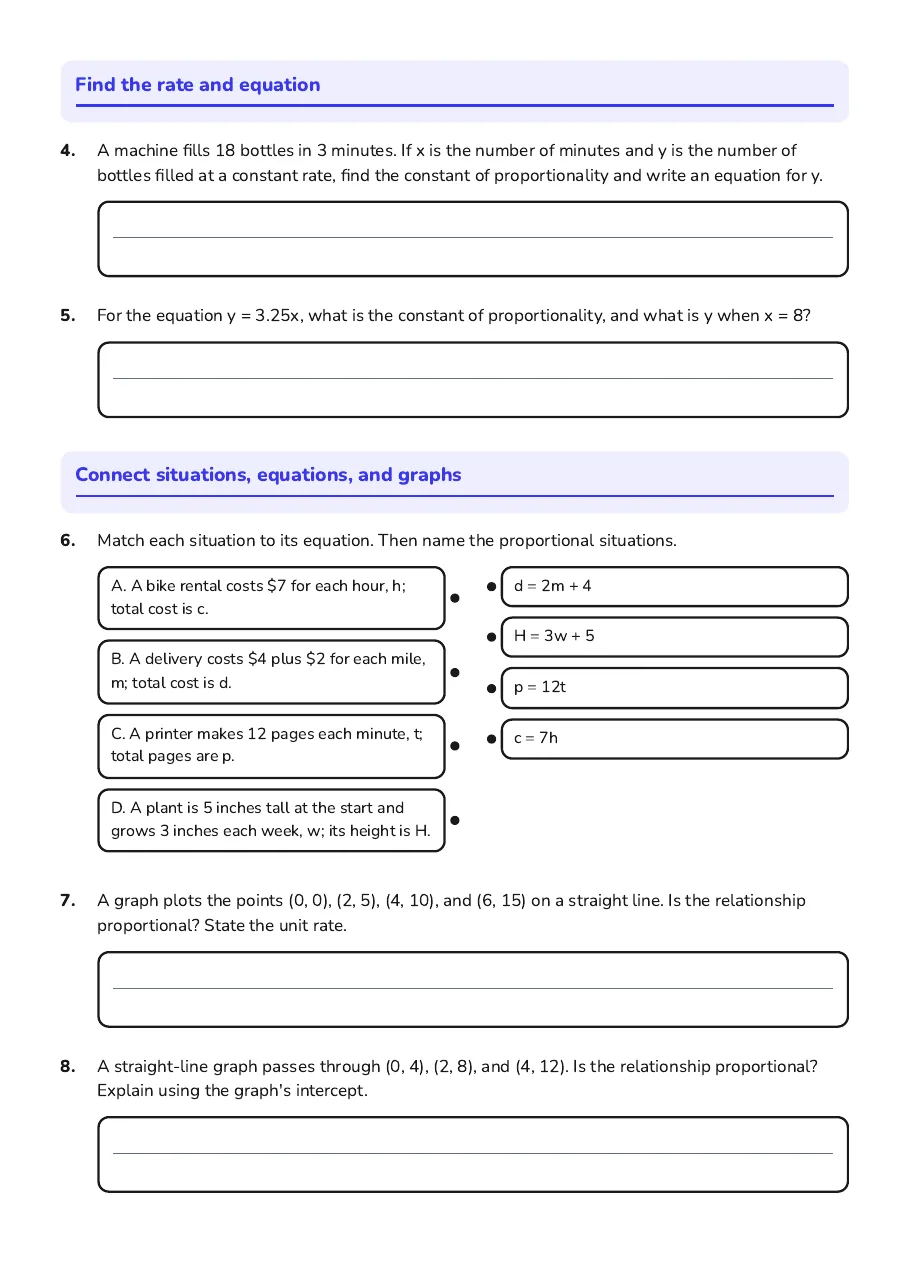
Find the rate and equation
4.A machine fills 18 bottles in 3 minutes. If x is the number of minutes and y is the number of bottles filled at a constant rate, find the constant of proportionality and write an equation for y.
5.For the equation y = 3.25x, what is the constant of proportionality, and what is y when x = 8?
Connect situations, equations, and graphs
6.Match each situation to its equation. Then name the proportional situations.
- A. A bike rental costs $7 for each hour, h; total cost is c.
- B. A delivery costs $4 plus $2 for each mile, m; total cost is d.
- C. A printer makes 12 pages each minute, t; total pages are p.
- D. A plant is 5 inches tall at the start and grows 3 inches each week, w; its height is H.
- d = 2m + 4
- H = 3w + 5
- p = 12t
- c = 7h
7.A graph plots the points (0, 0), (2, 5), (4, 10), and (6, 15) on a straight line. Is the relationship proportional? State the unit rate.
8.A straight-line graph passes through (0, 4), (2, 8), and (4, 12). Is the relationship proportional? Explain using the graph's intercept.
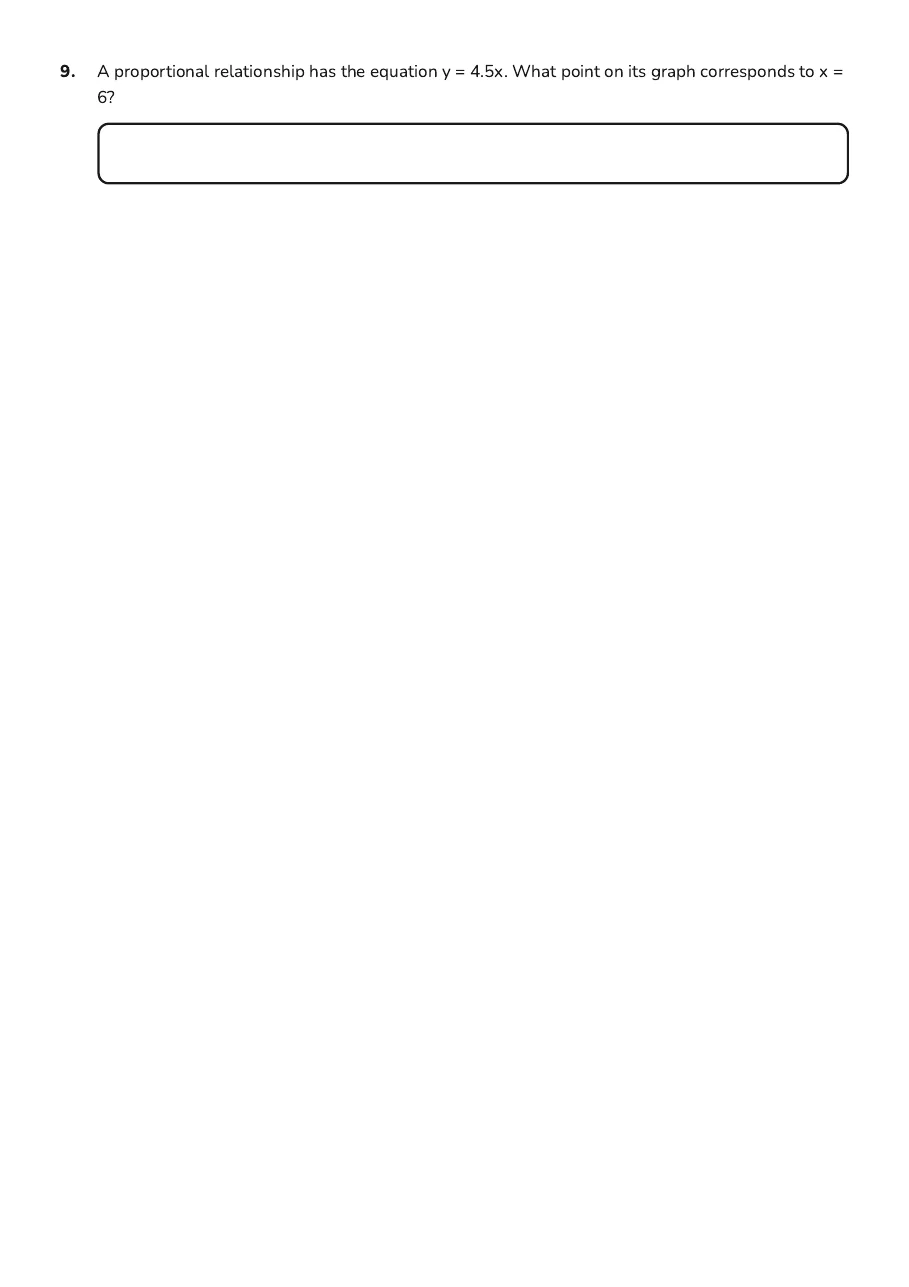
9.A proportional relationship has the equation y = 4.5x. What point on its graph corresponds to x = 6?
3 printable pages
Page 1
Page 2
Page 3
About This Worksheet
Free in Kuraplan
Sign up free, grab the PDF, and customize it for your class.
Print-Ready
Formatted for standard paper. Clean layout, easy to read.
AI-Generated
Created with Kuraplan's AI, designed for real classroom use.
For Teachers & Parents
Use in classrooms, for homework, tutoring, or homeschool.
Need a custom version of this worksheet?
Kuraplan's AI generates custom worksheets in seconds — differentiated for every learner, aligned to your curriculum.
Generate Custom Worksheets — Free No credit card Curriculum-aligned Under 60 seconds
More Mathematics Worksheets
7th Grade
Real-World Ratios Worksheet
Free
8th Grade
Proportional and Linear Relationships
Free
7th Grade
Constant of Proportionality
Free
7th Grade
Unit Rate Practice
Free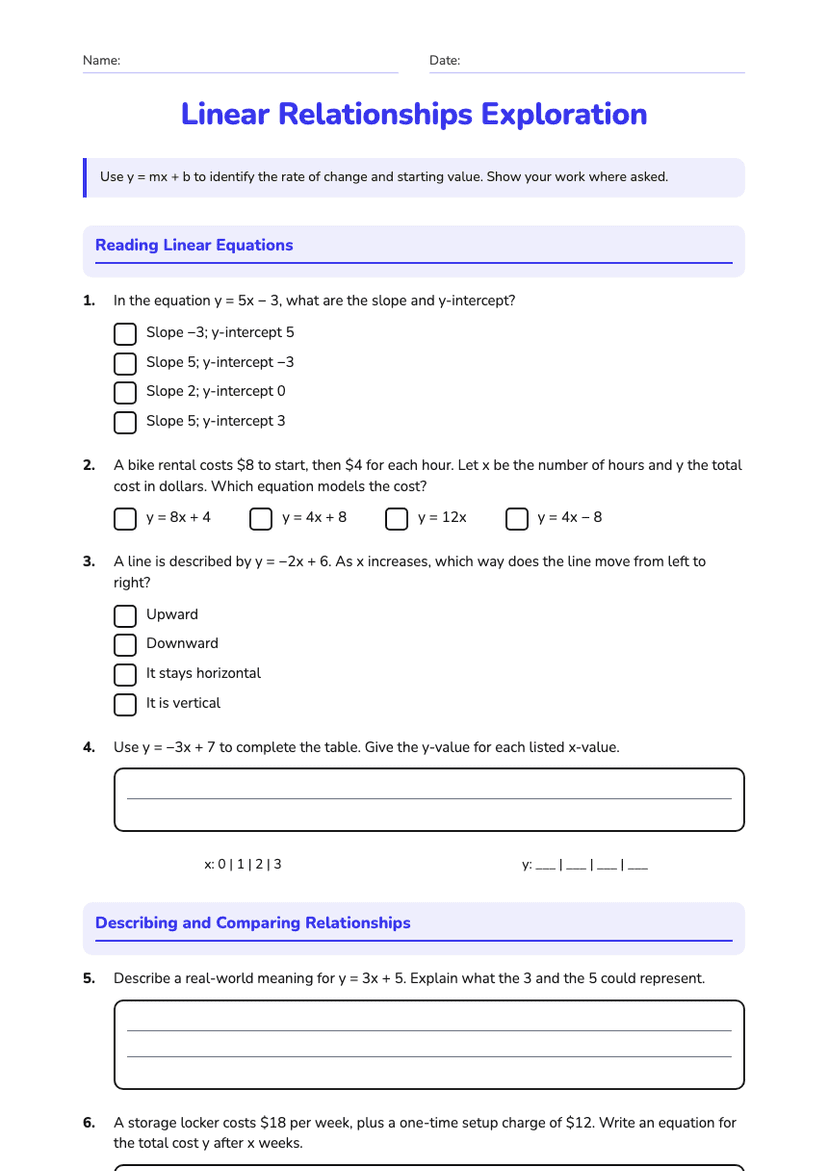
7th Grade
Linear Relationships Exploration
Free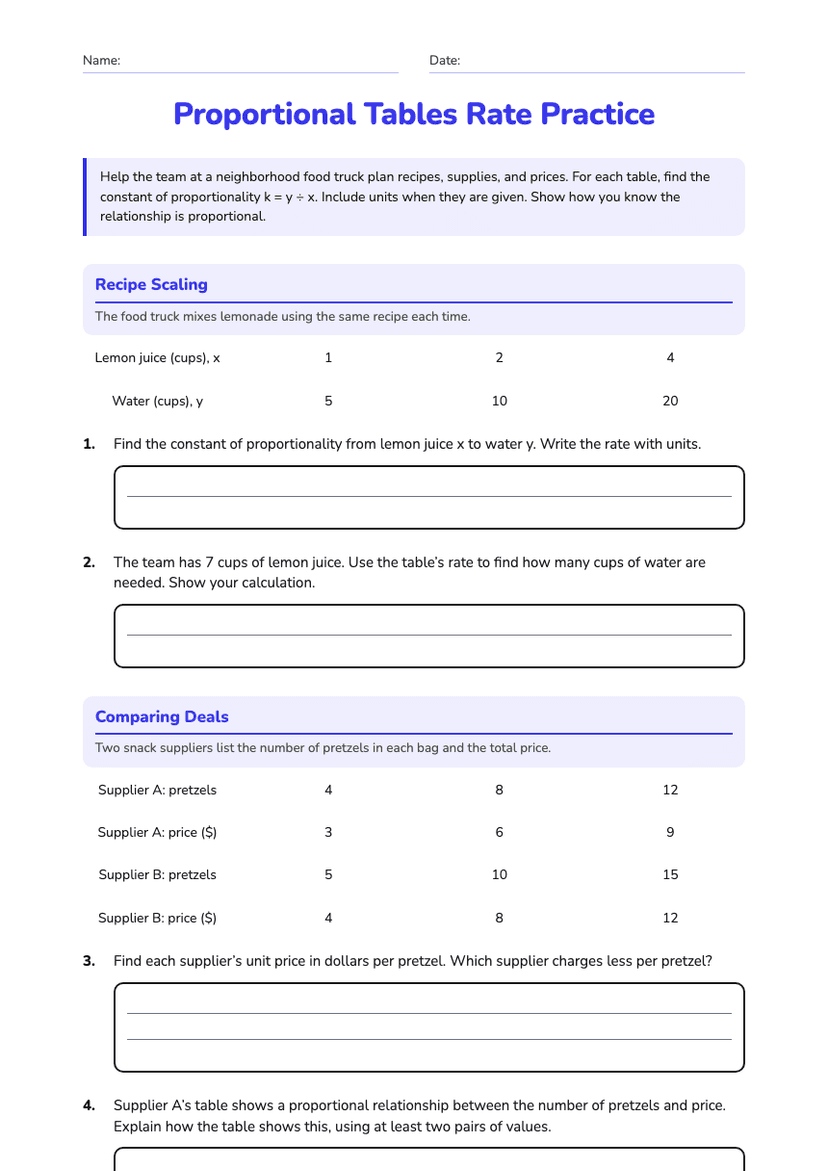
Proportional Tables Rate Practice
Free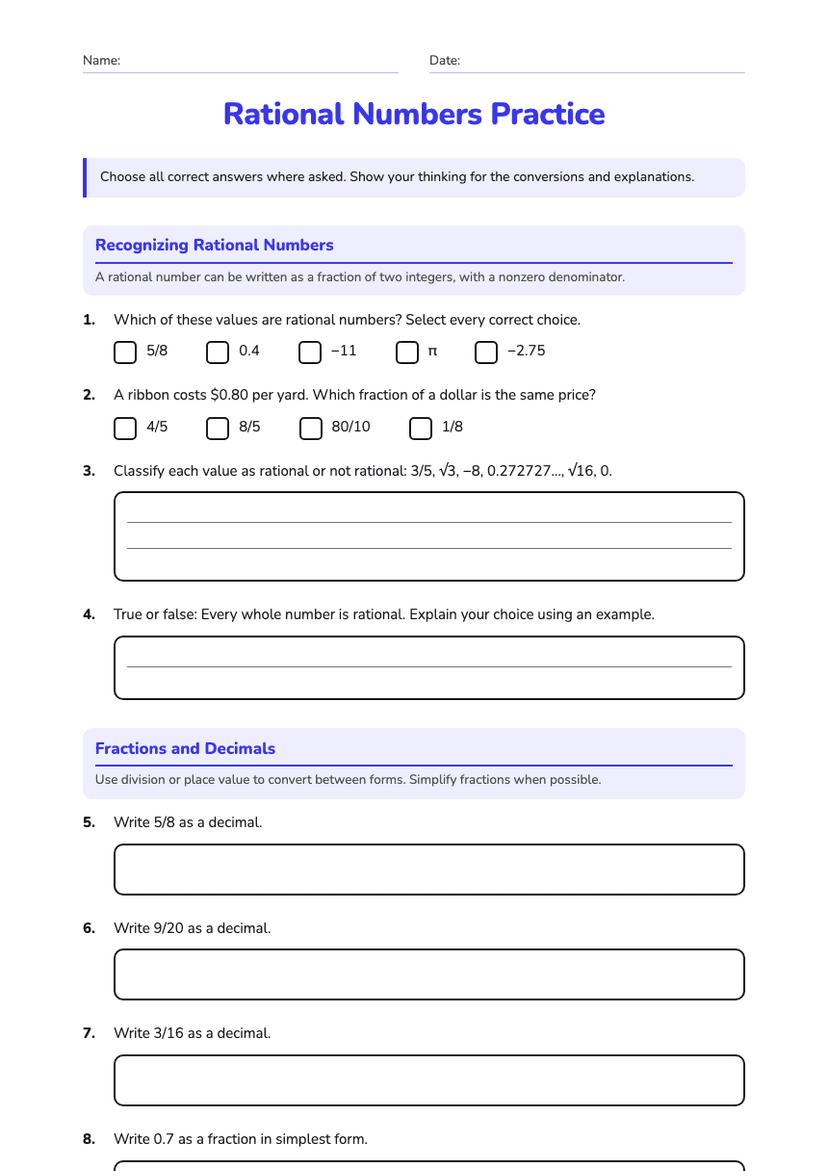
6th Grade
Rational Numbers Practice
Free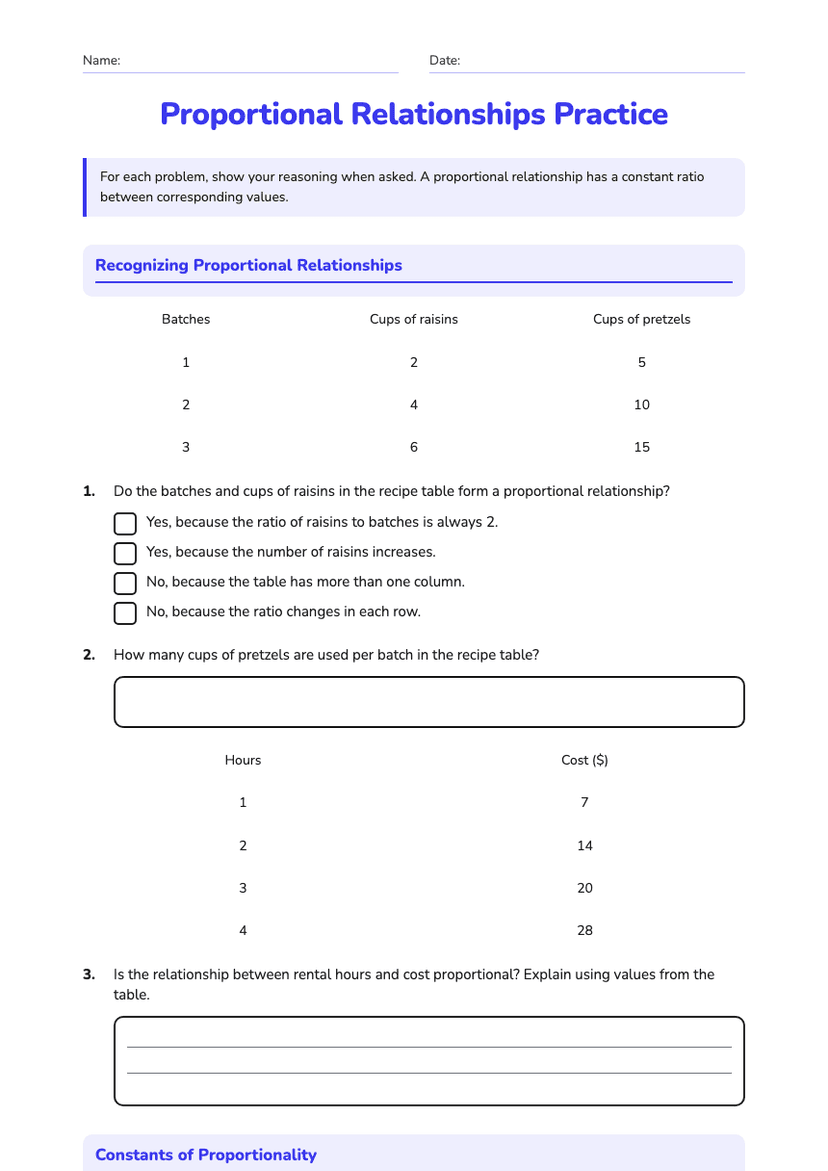
7th Grade