ScienceFreePrintable
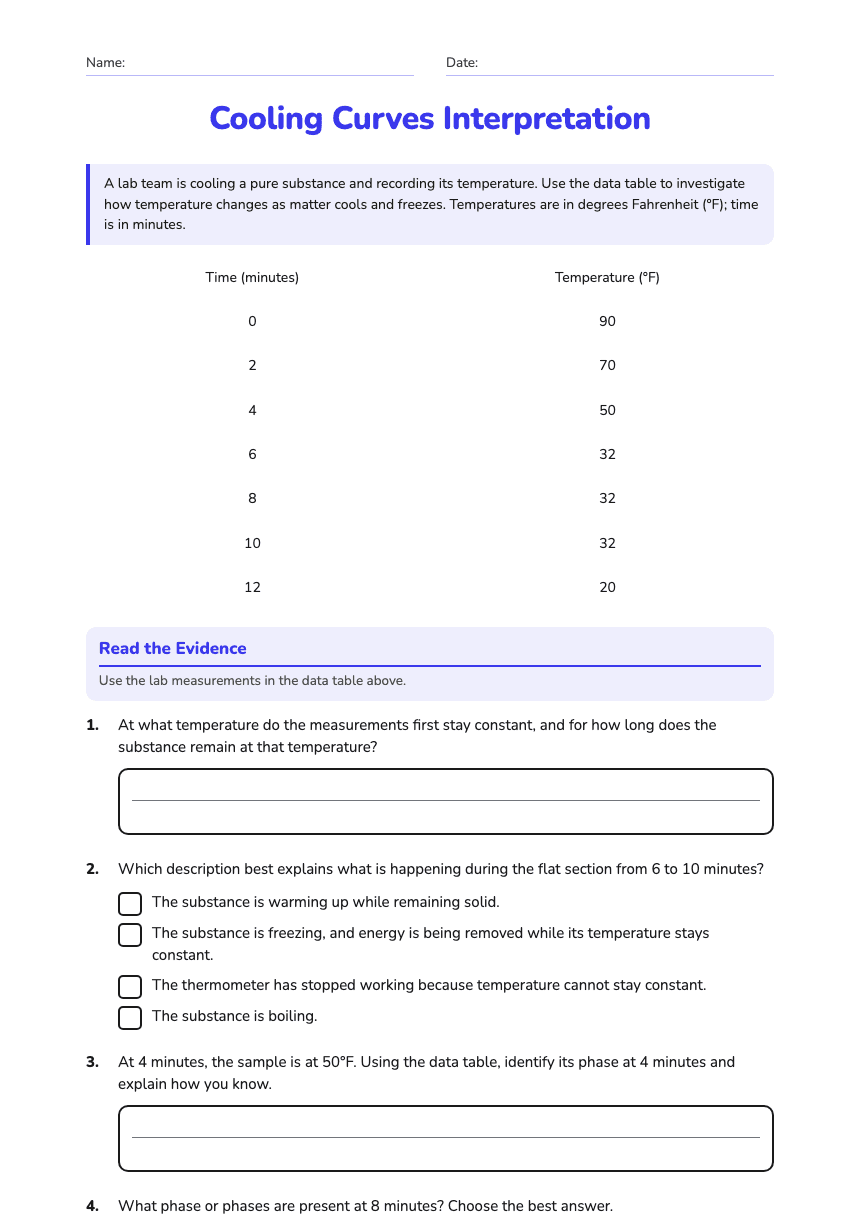
Cooling Curves Interpretation
A free science worksheet ready for your classroom. Open in Kuraplan to grab the print-ready PDF, customize it for your students, or generate a fresh version in seconds.
Name:Date:
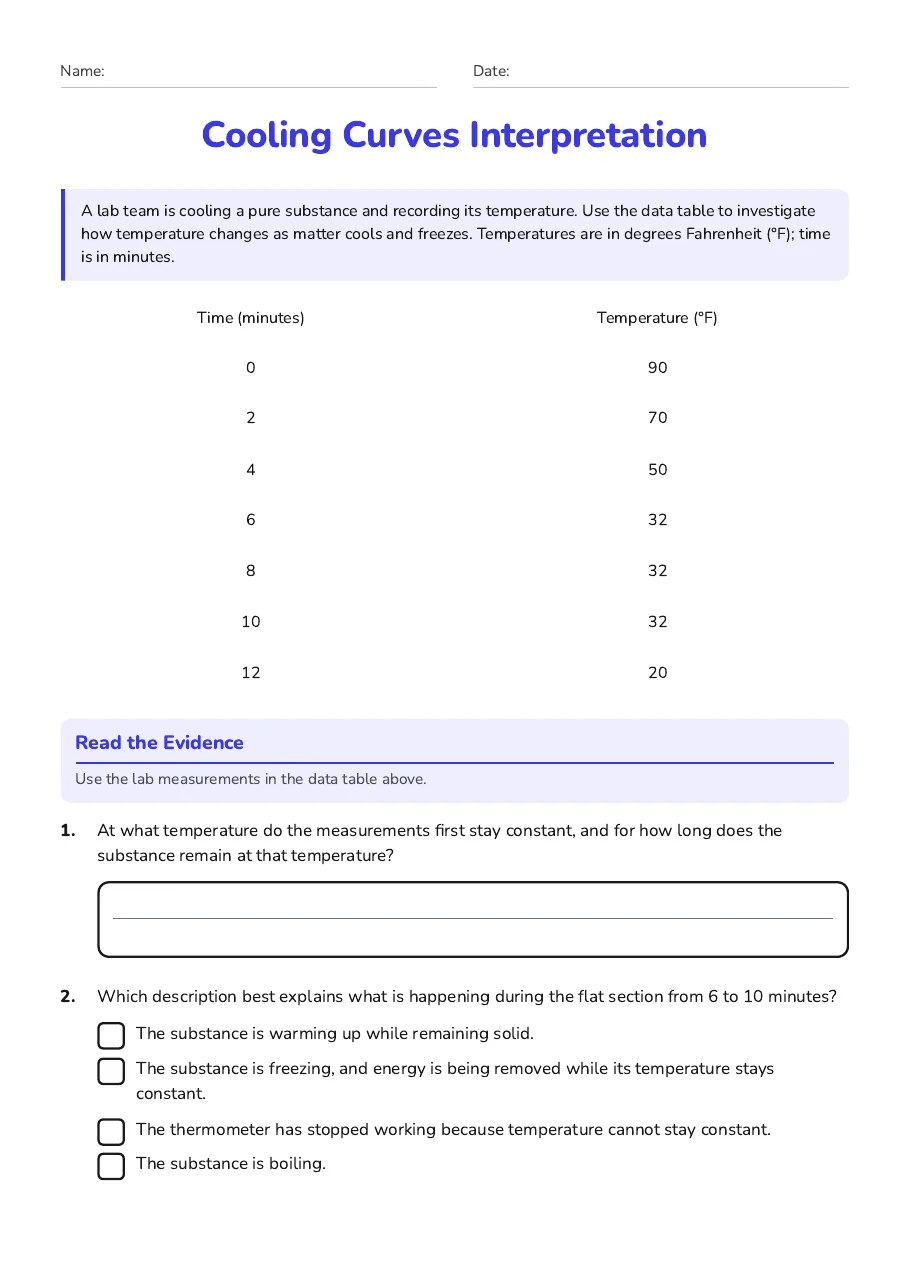
Cooling Curves Interpretation
A lab team is cooling a pure substance and recording its temperature. Use the data table to investigate how temperature changes as matter cools and freezes. Temperatures are in degrees Fahrenheit (°F); time is in minutes.
Time (minutes)
Temperature (°F)
0
90
2
70
4
50
6
32
8
32
10
32
12
20
Read the Evidence
Use the lab measurements in the data table above.
1.At what temperature do the measurements first stay constant, and for how long does the substance remain at that temperature?
2.Which description best explains what is happening during the flat section from 6 to 10 minutes?
- The substance is warming up while remaining solid.
- The substance is freezing, and energy is being removed while its temperature stays constant.
- The thermometer has stopped working because temperature cannot stay constant.
- The substance is boiling.
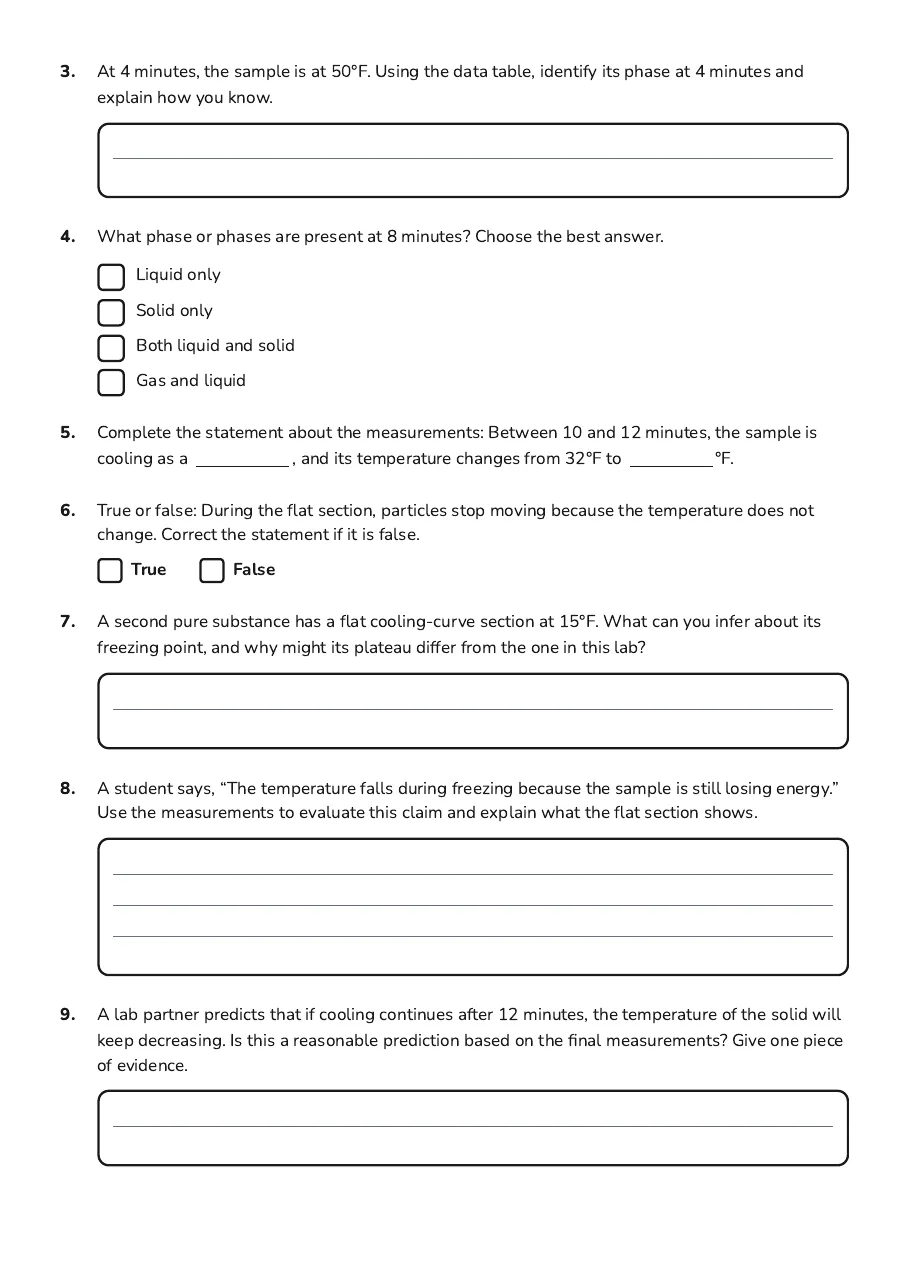
3.At 4 minutes, the sample is at 50°F. Using the data table, identify its phase at 4 minutes and explain how you know.
4.What phase or phases are present at 8 minutes? Choose the best answer.
- Liquid only
- Solid only
- Both liquid and solid
- Gas and liquid
5.Complete the statement about the measurements: Between 10 and 12 minutes, the sample is cooling as a , and its temperature changes from 32°F to °F.
6.True or false: During the flat section, particles stop moving because the temperature does not change. Correct the statement if it is false.
TrueFalse
7.A second pure substance has a flat cooling-curve section at 15°F. What can you infer about its freezing point, and why might its plateau differ from the one in this lab?
8.A student says, “The temperature falls during freezing because the sample is still losing energy.” Use the measurements to evaluate this claim and explain what the flat section shows.
9.A lab partner predicts that if cooling continues after 12 minutes, the temperature of the solid will keep decreasing. Is this a reasonable prediction based on the final measurements? Give one piece of evidence.
2 printable pages
Page 1
Page 2
About This Worksheet
Free in Kuraplan
Sign up free, grab the PDF, and customize it for your class.
Print-Ready
Formatted for standard paper. Clean layout, easy to read.
AI-Generated
Created with Kuraplan's AI, designed for real classroom use.
For Teachers & Parents
Use in classrooms, for homework, tutoring, or homeschool.
Need a custom version of this worksheet?
Kuraplan's AI generates custom worksheets in seconds — differentiated for every learner, aligned to your curriculum.
Generate Custom Worksheets — Free No credit card Curriculum-aligned Under 60 seconds
More Science Worksheets
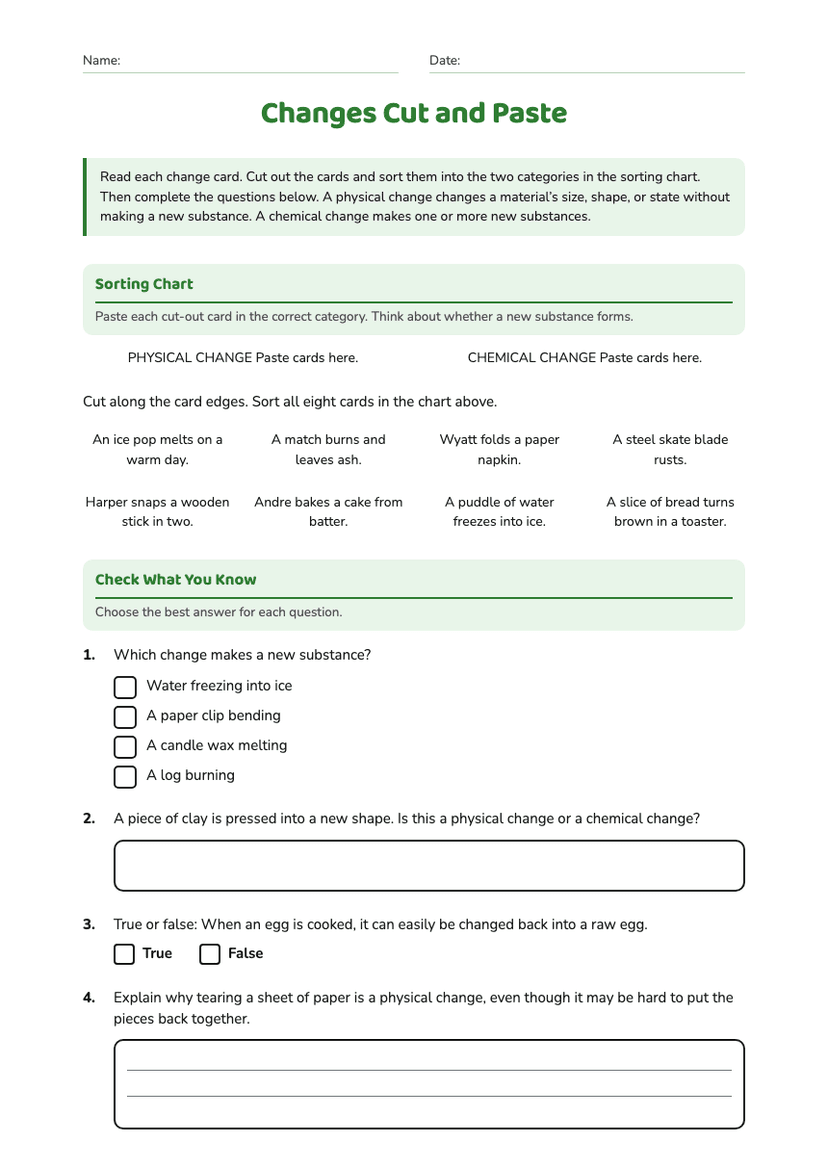
Changes Cut and Paste
Free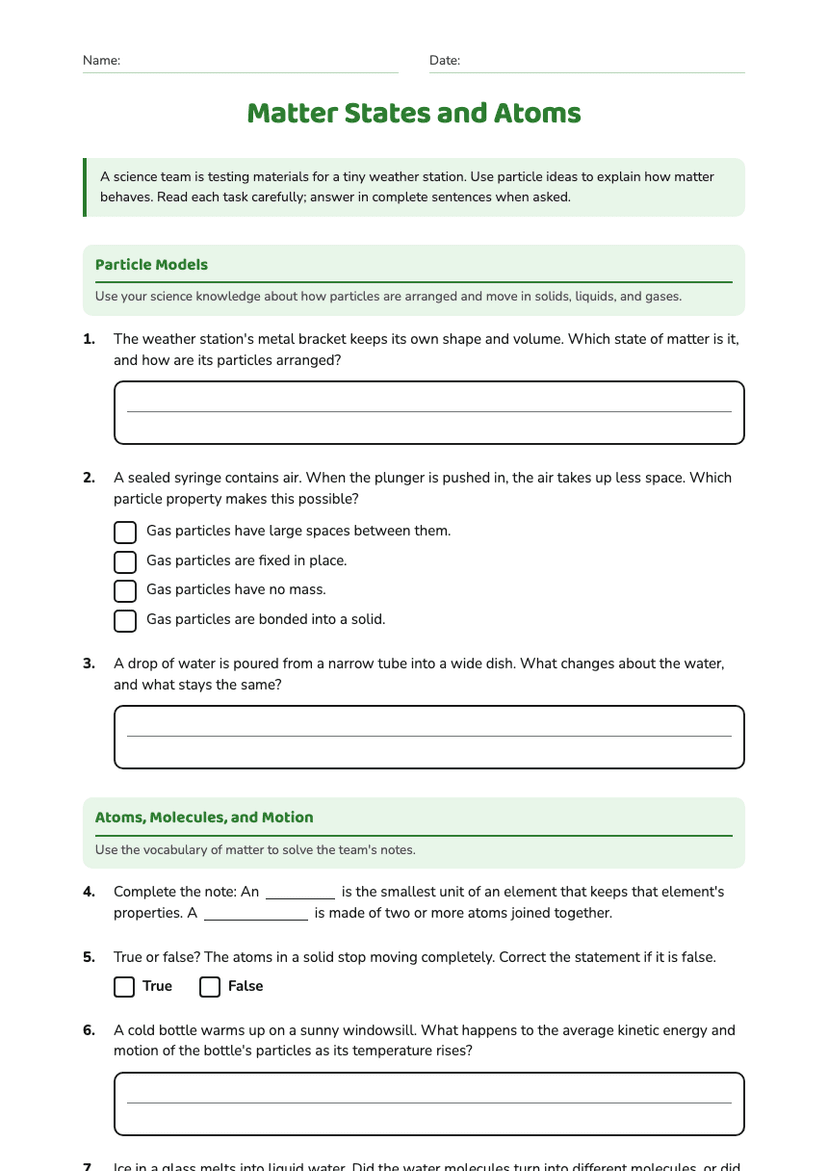
6th Grade
Matter States and Atoms
Free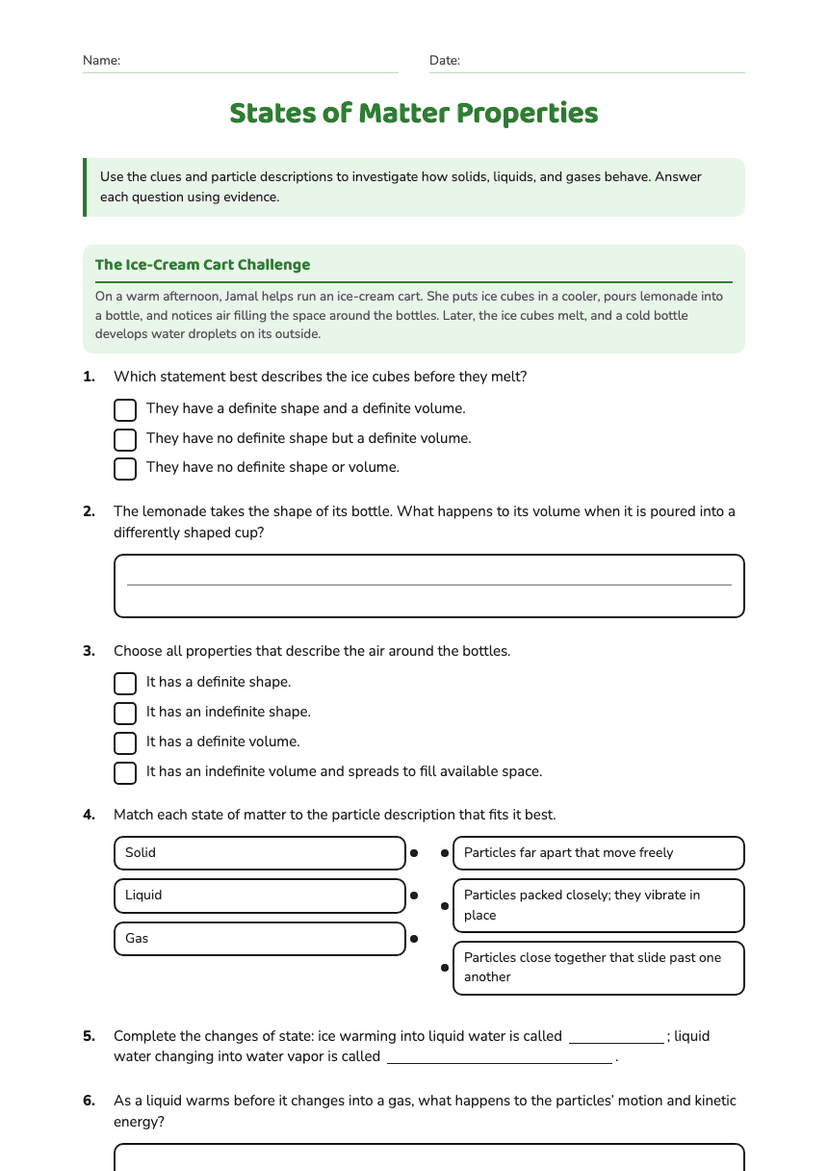
6th Grade
States of Matter Properties
Free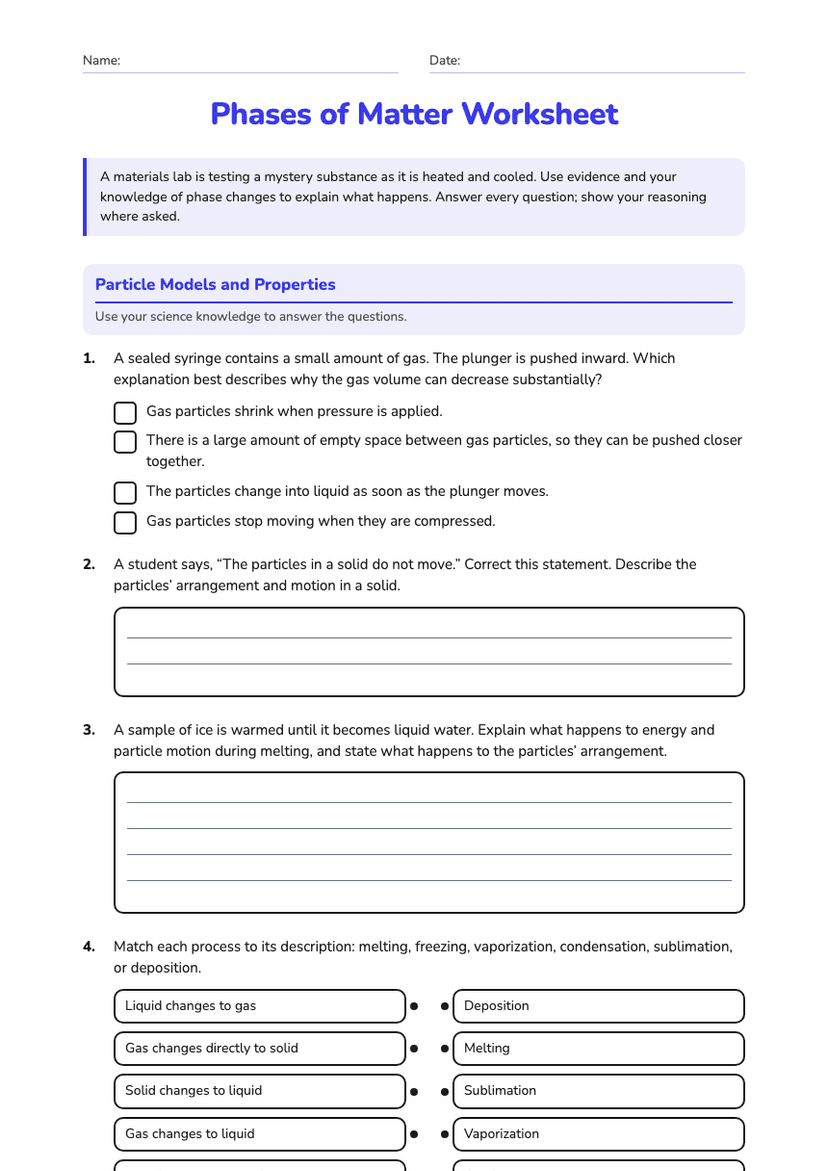
10th Grade–11th Grade
Phases of Matter Worksheet
Free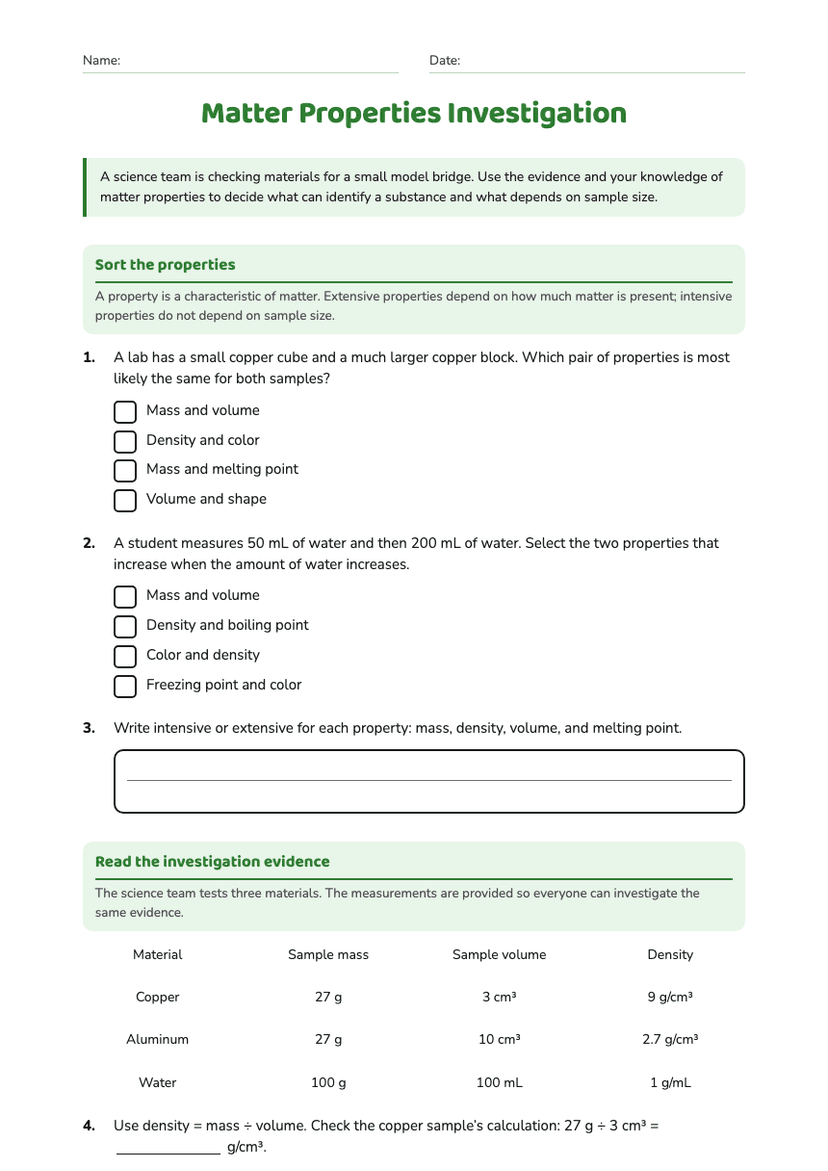
6th Grade
Matter Properties Investigation
Free
10th Grade–11th Grade
Matter Properties Exploration Worksheet
Free
Matter Changes
Free
6th Grade