MathsFreePrintable
Creating Bar Graphs
A free maths worksheet ready for your classroom. Open in Kuraplan to grab the print-ready PDF, customize it for your students, or generate a fresh version in seconds.

Name:Date:
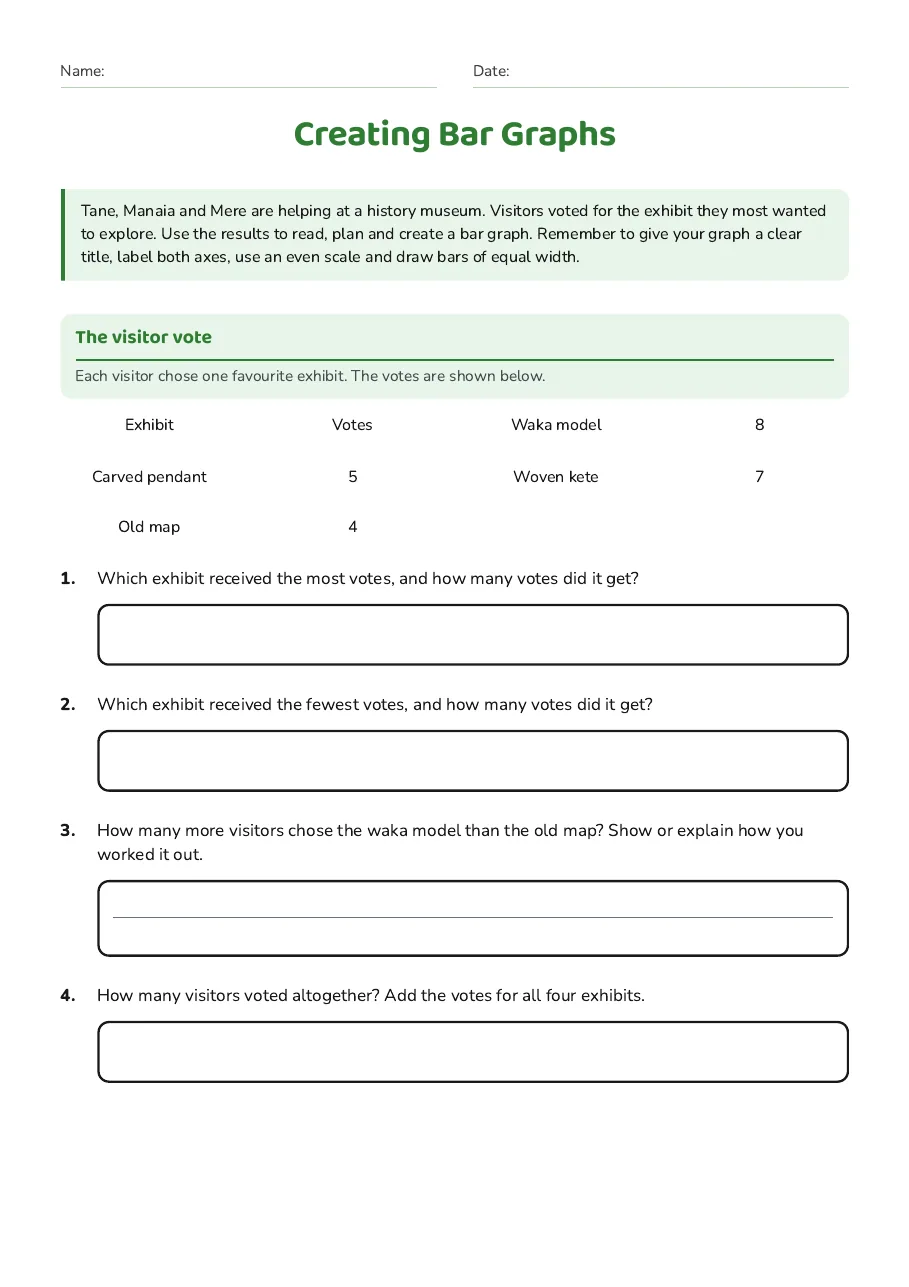
Creating Bar Graphs
Tane, Manaia and Mere are helping at a history museum. Visitors voted for the exhibit they most wanted to explore. Use the results to read, plan and create a bar graph. Remember to give your graph a clear title, label both axes, use an even scale and draw bars of equal width.
The visitor vote
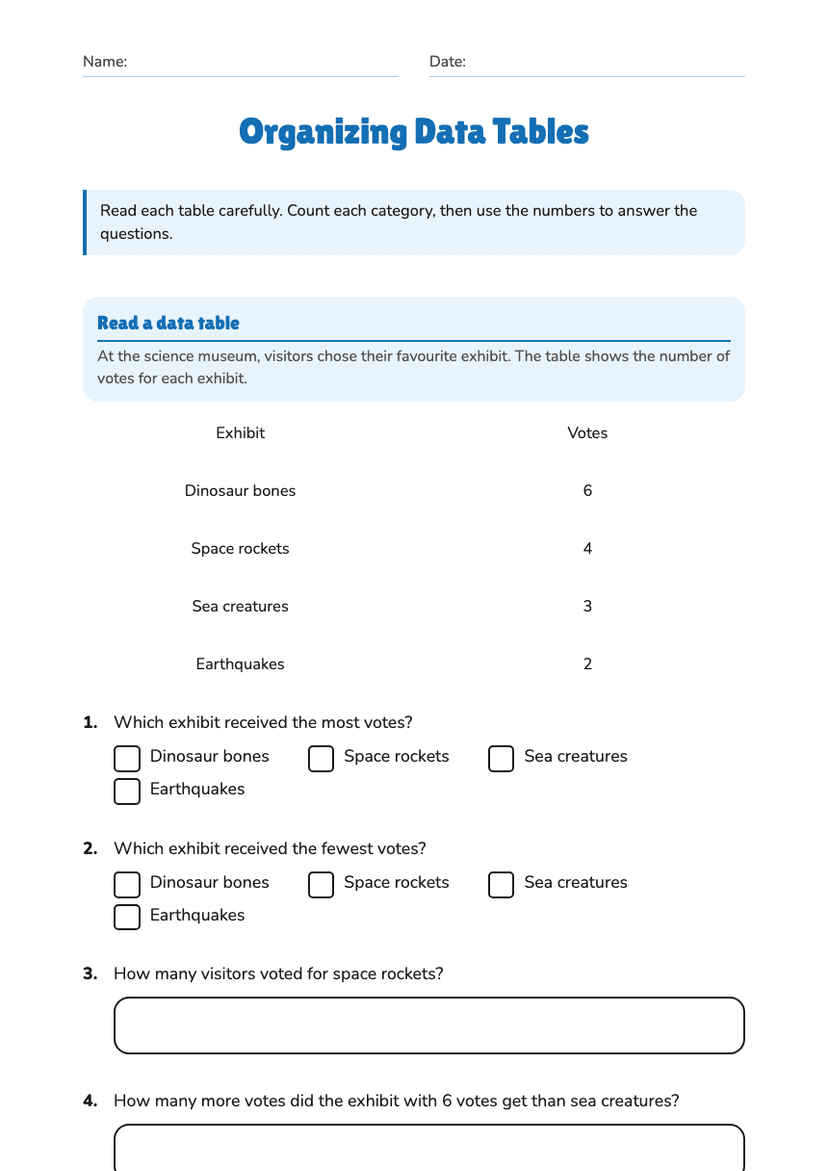
Each visitor chose one favourite exhibit. The votes are shown below.
Exhibit
Votes
Waka model
8
Carved pendant
5
Woven kete
7
Old map
4
1.Which exhibit received the most votes, and how many votes did it get?
2.Which exhibit received the fewest votes, and how many votes did it get?
3.How many more visitors chose the waka model than the old map? Show or explain how you worked it out.
4.How many visitors voted altogether? Add the votes for all four exhibits.
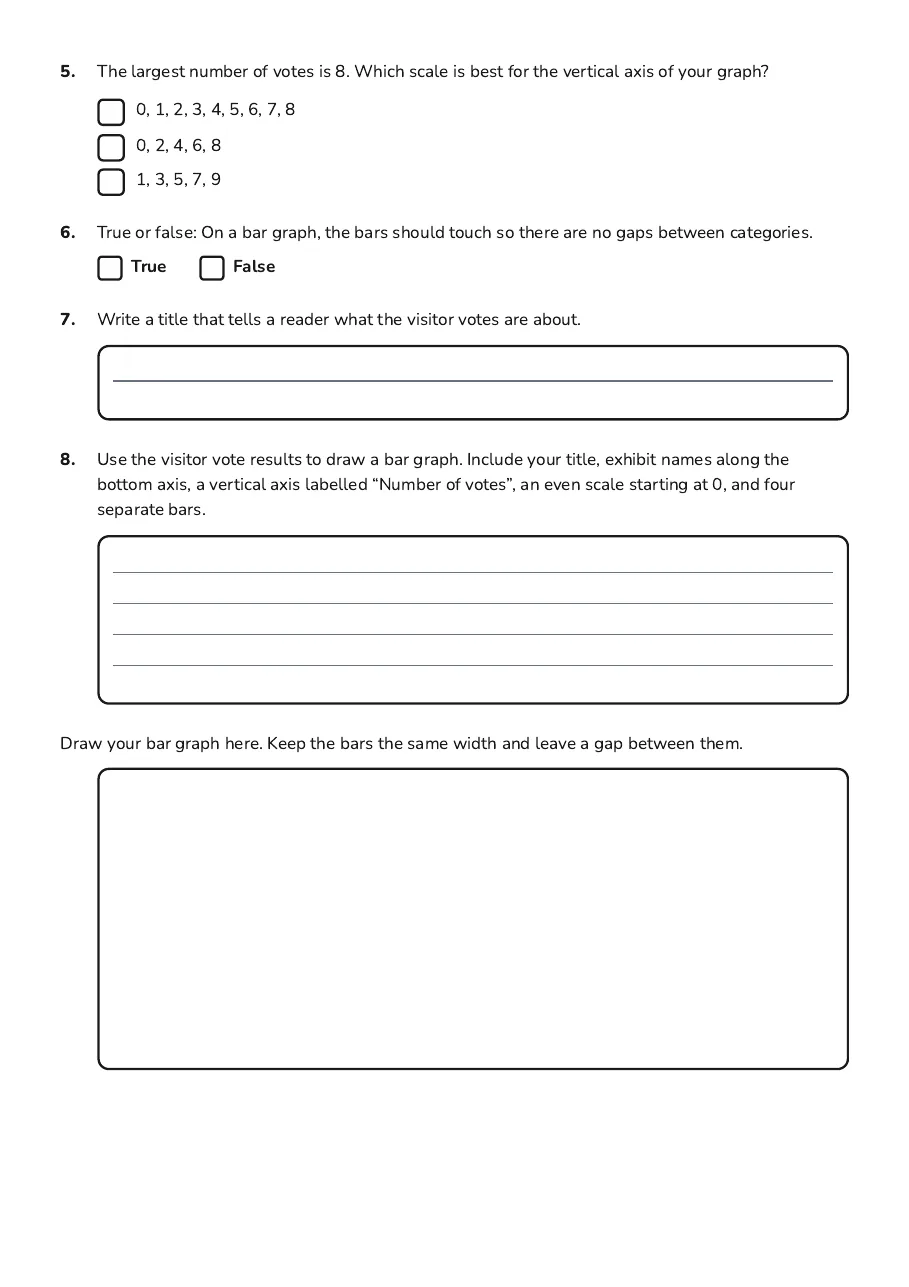
5.The largest number of votes is 8. Which scale is best for the vertical axis of your graph?
- 0, 1, 2, 3, 4, 5, 6, 7, 8
- 0, 2, 4, 6, 8
- 1, 3, 5, 7, 9
6.True or false: On a bar graph, the bars should touch so there are no gaps between categories.
TrueFalse
7.Write a title that tells a reader what the visitor votes are about.
8.Use the visitor vote results to draw a bar graph. Include your title, exhibit names along the bottom axis, a vertical axis labelled “Number of votes”, an even scale starting at 0, and four separate bars.
Draw your bar graph here. Keep the bars the same width and leave a gap between them.
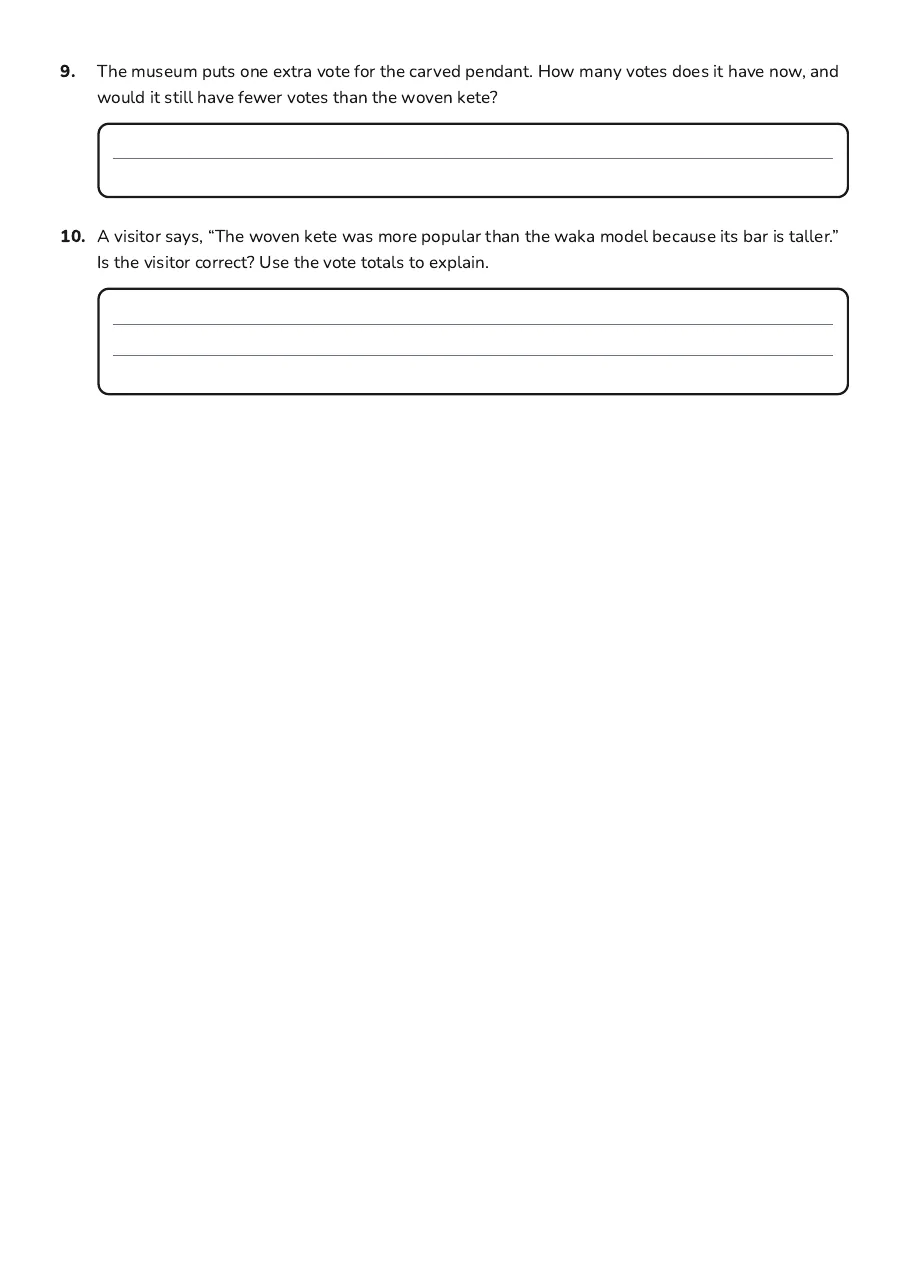
9.The museum puts one extra vote for the carved pendant. How many votes does it have now, and would it still have fewer votes than the woven kete?
10.A visitor says, “The woven kete was more popular than the waka model because its bar is taller.” Is the visitor correct? Use the vote totals to explain.
3 printable pages
Page 1
Page 2
Page 3
About This Worksheet
Free in Kuraplan
Sign up free, grab the PDF, and customize it for your class.
Print-Ready
Formatted for standard paper. Clean layout, easy to read.
AI-Generated
Created with Kuraplan's AI, designed for real classroom use.
For Teachers & Parents
Use in classrooms, for homework, tutoring, or homeschool.
Need a custom version of this worksheet?
Kuraplan's AI generates custom worksheets in seconds — differentiated for every learner, aligned to your curriculum.
Generate Custom Worksheets — Free No credit card Curriculum-aligned Under 60 seconds