MathsFreePrintable

Drawing Data Conclusions

A free maths worksheet ready for your classroom. Open in Kuraplan to grab the print-ready PDF, customize it for your students, or generate a fresh version in seconds.
Drawing Data Conclusions worksheet preview
Name:Date:

Drawing Data Conclusions

Read each data display carefully. Draw conclusions that answer the investigation question, use evidence from the data, and avoid claiming more than the data can show.

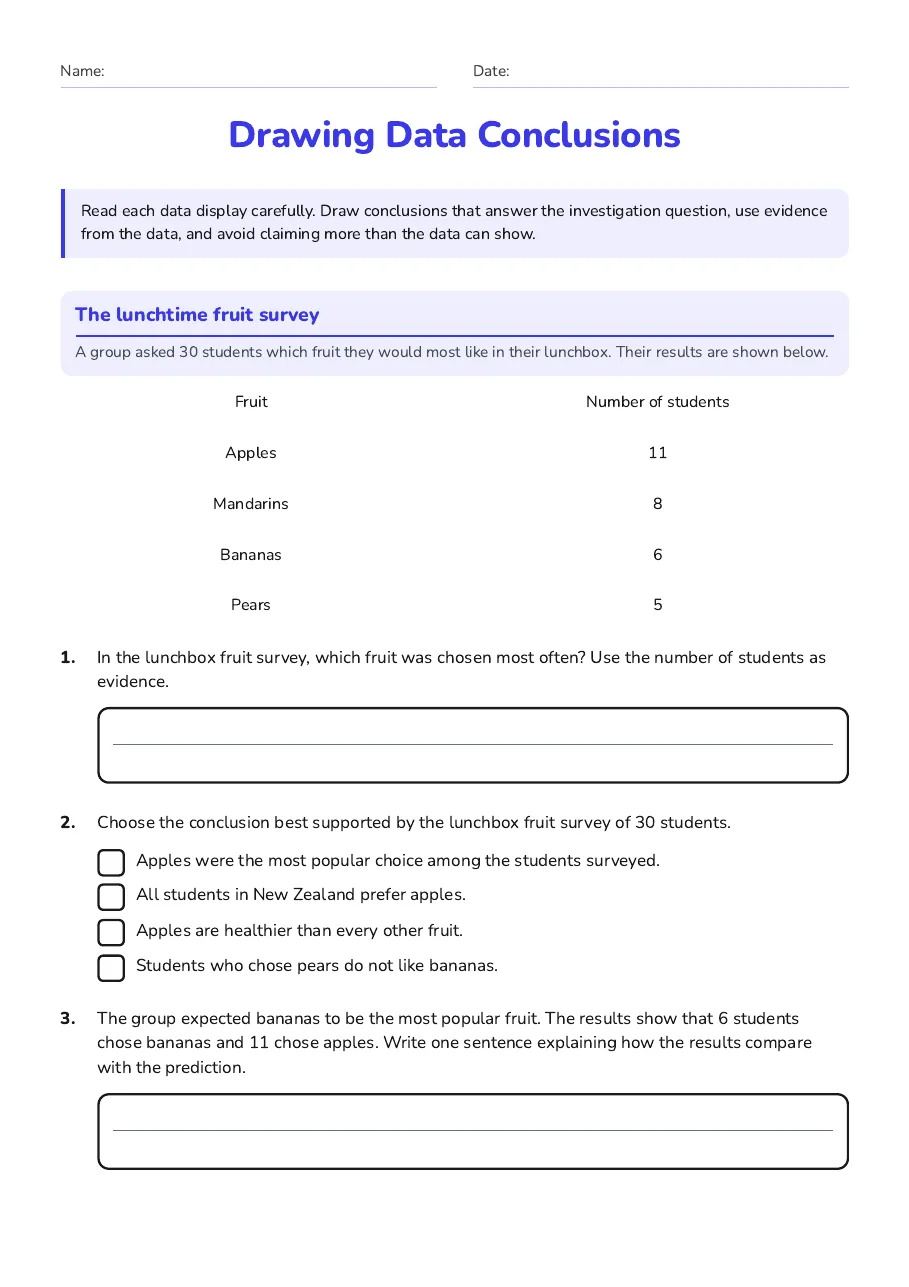
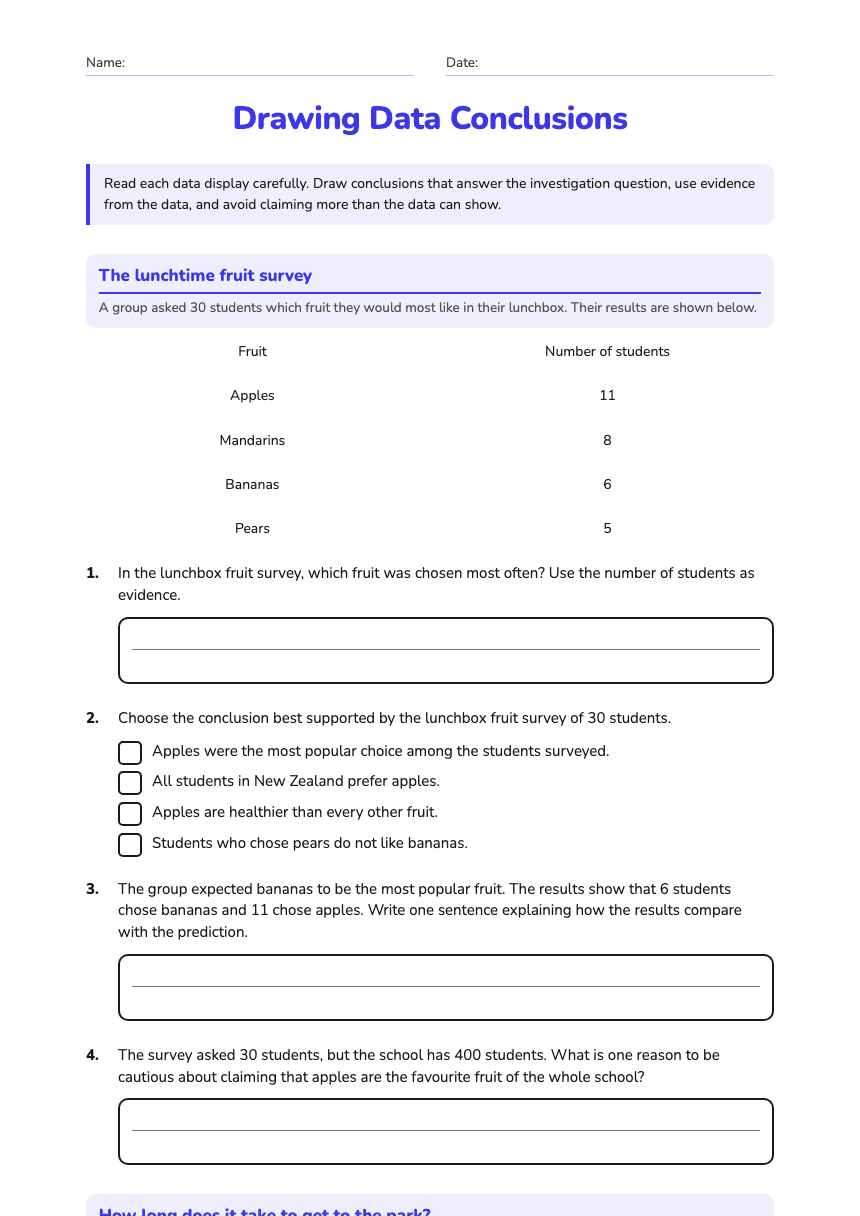
The lunchtime fruit survey

A group asked 30 students which fruit they would most like in their lunchbox. Their results are shown below.

Fruit

Number of students

Apples

11

Mandarins

8

Bananas

6

Pears

5

1.In the lunchbox fruit survey, which fruit was chosen most often? Use the number of students as evidence.
2.Choose the conclusion best supported by the lunchbox fruit survey of 30 students.
  • Apples were the most popular choice among the students surveyed.
  • All students in New Zealand prefer apples.
  • Apples are healthier than every other fruit.
  • Students who chose pears do not like bananas.
3.The group expected bananas to be the most popular fruit. The results show that 6 students chose bananas and 11 chose apples. Write one sentence explaining how the results compare with the prediction.
4.The survey asked 30 students, but the school has 400 students. What is one reason to be cautious about claiming that apples are the favourite fruit of the whole school?

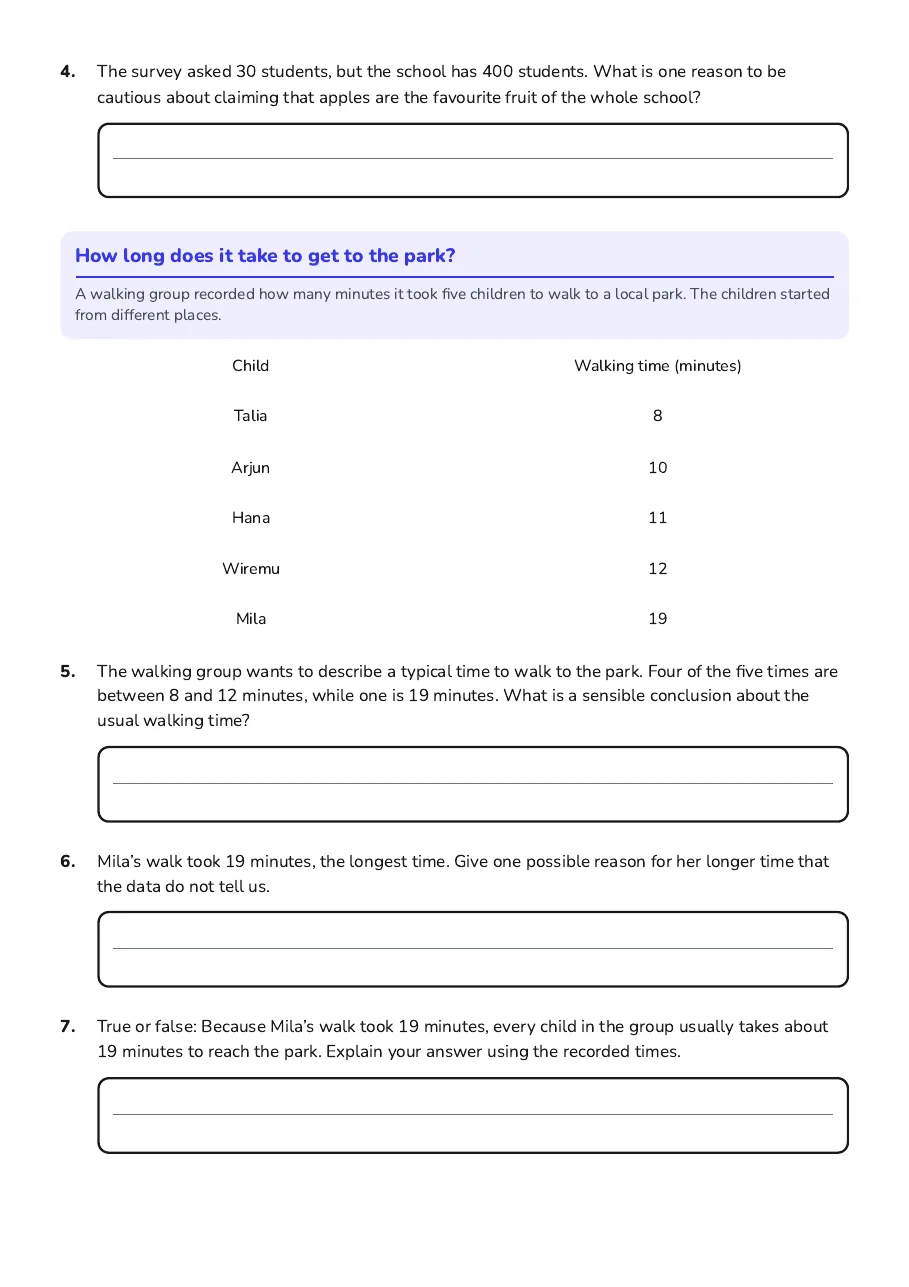
How long does it take to get to the park?

A walking group recorded how many minutes it took five children to walk to a local park. The children started from different places.

Child

Walking time (minutes)

Talia

8

Arjun

10

Hana

11

Wiremu

12

Mila

19

5.The walking group wants to describe a typical time to walk to the park. Four of the five times are between 8 and 12 minutes, while one is 19 minutes. What is a sensible conclusion about the usual walking time?
6.Mila’s walk took 19 minutes, the longest time. Give one possible reason for her longer time that the data do not tell us.
7.True or false: Because Mila’s walk took 19 minutes, every child in the group usually takes about 19 minutes to reach the park. Explain your answer using the recorded times.
8.Write a short conclusion answering this question: “How long did it take this walking group to reach the park?” Include a specific piece of evidence and one limit of what can be concluded.

3 printable pages

  • Drawing Data Conclusions, page 1 of 3: The lunchtime fruit survey

    Page 1

  • Drawing Data Conclusions, page 2 of 3: How long does it take to get to the park?

    Page 2

  • Drawing Data Conclusions, page 3 of 3: 8. Write a short conclusion answering this question: “How long did it take this walking…

    Page 3

About This Worksheet

Free in Kuraplan

Sign up free, grab the PDF, and customize it for your class.

Print-Ready

Formatted for standard paper. Clean layout, easy to read.

AI-Generated

Created with Kuraplan's AI, designed for real classroom use.

For Teachers & Parents

Use in classrooms, for homework, tutoring, or homeschool.

Need a custom version of this worksheet?

Kuraplan's AI generates custom worksheets in seconds — differentiated for every learner, aligned to your curriculum.

Generate Custom Worksheets — Free
No credit card Curriculum-aligned Under 60 seconds