ScienceFreePrintable

Temperature and Solubility Investigation

A free science worksheet ready for your classroom. Open in Kuraplan to grab the print-ready PDF, customize it for your students, or generate a fresh version in seconds.

Temperature and Solubility Investigation worksheet preview
Name:Date:

Temperature and Solubility Investigation

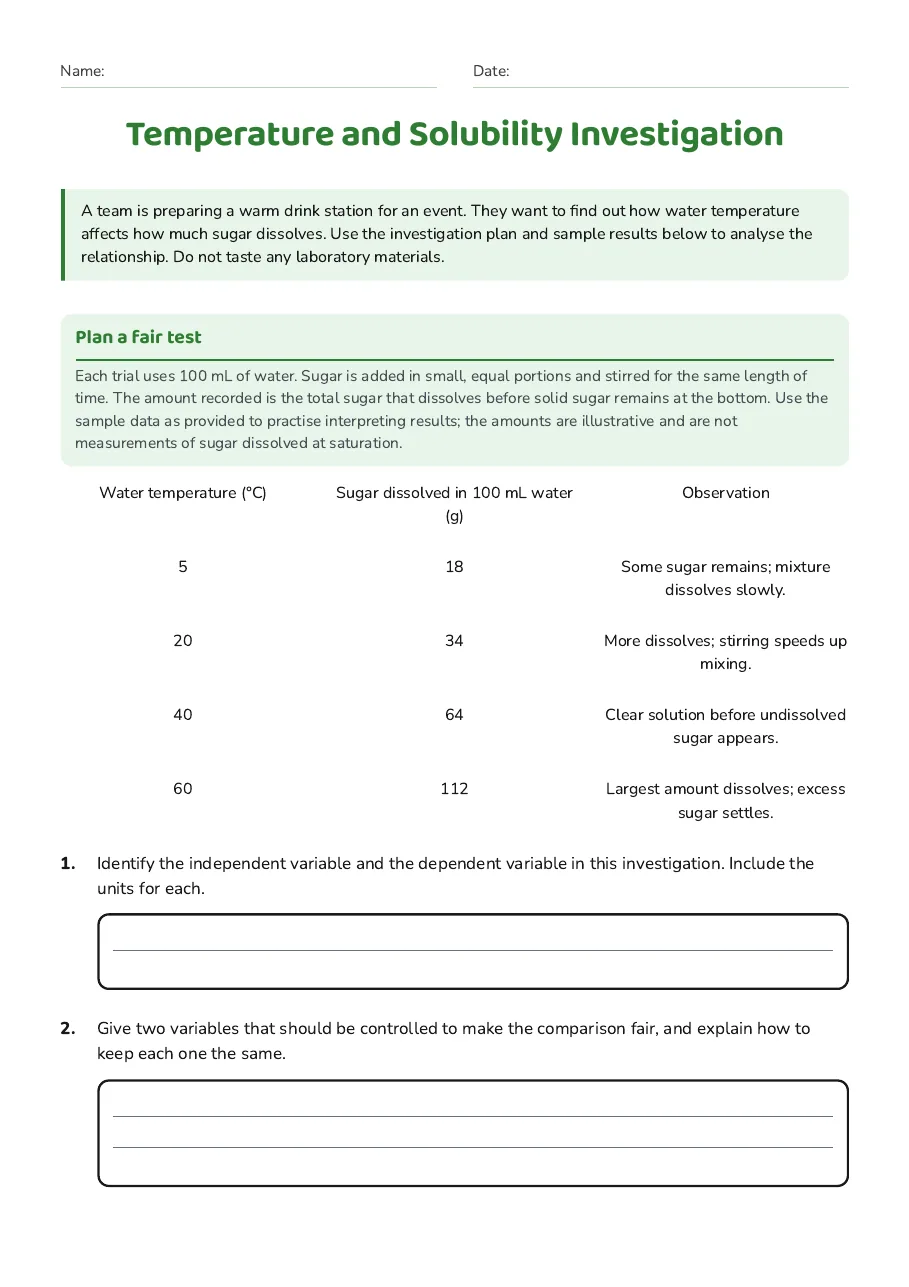
A team is preparing a warm drink station for an event. They want to find out how water temperature affects how much sugar dissolves. Use the investigation plan and sample results below to analyse the relationship. Do not taste any laboratory materials.

Plan a fair test

Each trial uses 100 mL of water. Sugar is added in small, equal portions and stirred for the same length of time. The amount recorded is the total sugar that dissolves before solid sugar remains at the bottom. Use the sample data as provided to practise interpreting results; the amounts are illustrative and are not measurements of sugar dissolved at saturation.

Water temperature (°C)

Sugar dissolved in 100 mL water (g)

Observation

5

18

Some sugar remains; mixture dissolves slowly.

20

34

More dissolves; stirring speeds up mixing.

40

64

Clear solution before undissolved sugar appears.

60

112

Largest amount dissolves; excess sugar settles.

1.Identify the independent variable and the dependent variable in this investigation. Include the units for each.
2.Give two variables that should be controlled to make the comparison fair, and explain how to keep each one the same.
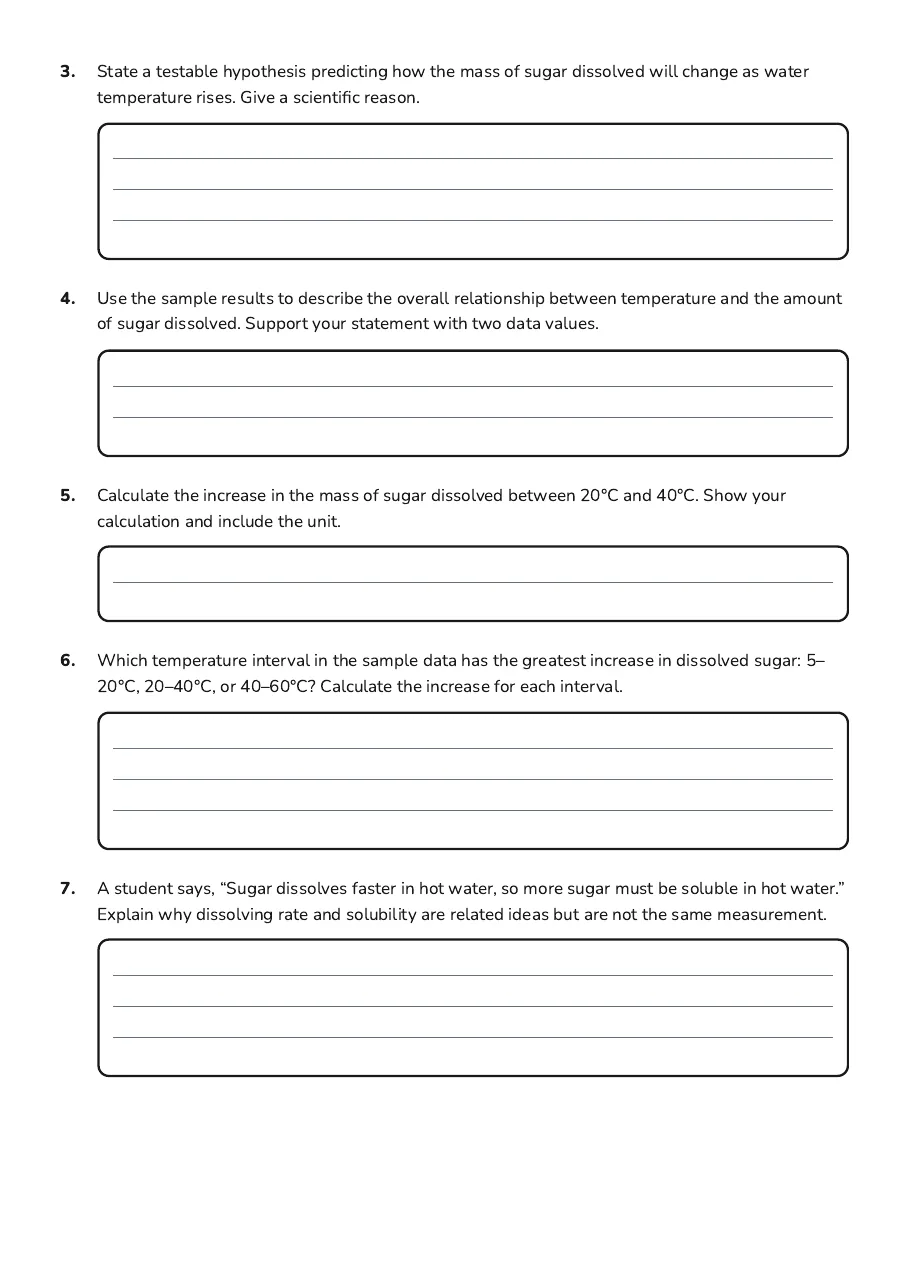
3.State a testable hypothesis predicting how the mass of sugar dissolved will change as water temperature rises. Give a scientific reason.
4.Use the sample results to describe the overall relationship between temperature and the amount of sugar dissolved. Support your statement with two data values.
5.Calculate the increase in the mass of sugar dissolved between 20°C and 40°C. Show your calculation and include the unit.
6.Which temperature interval in the sample data has the greatest increase in dissolved sugar: 5–20°C, 20–40°C, or 40–60°C? Calculate the increase for each interval.
7.A student says, “Sugar dissolves faster in hot water, so more sugar must be soluble in hot water.” Explain why dissolving rate and solubility are related ideas but are not the same measurement.
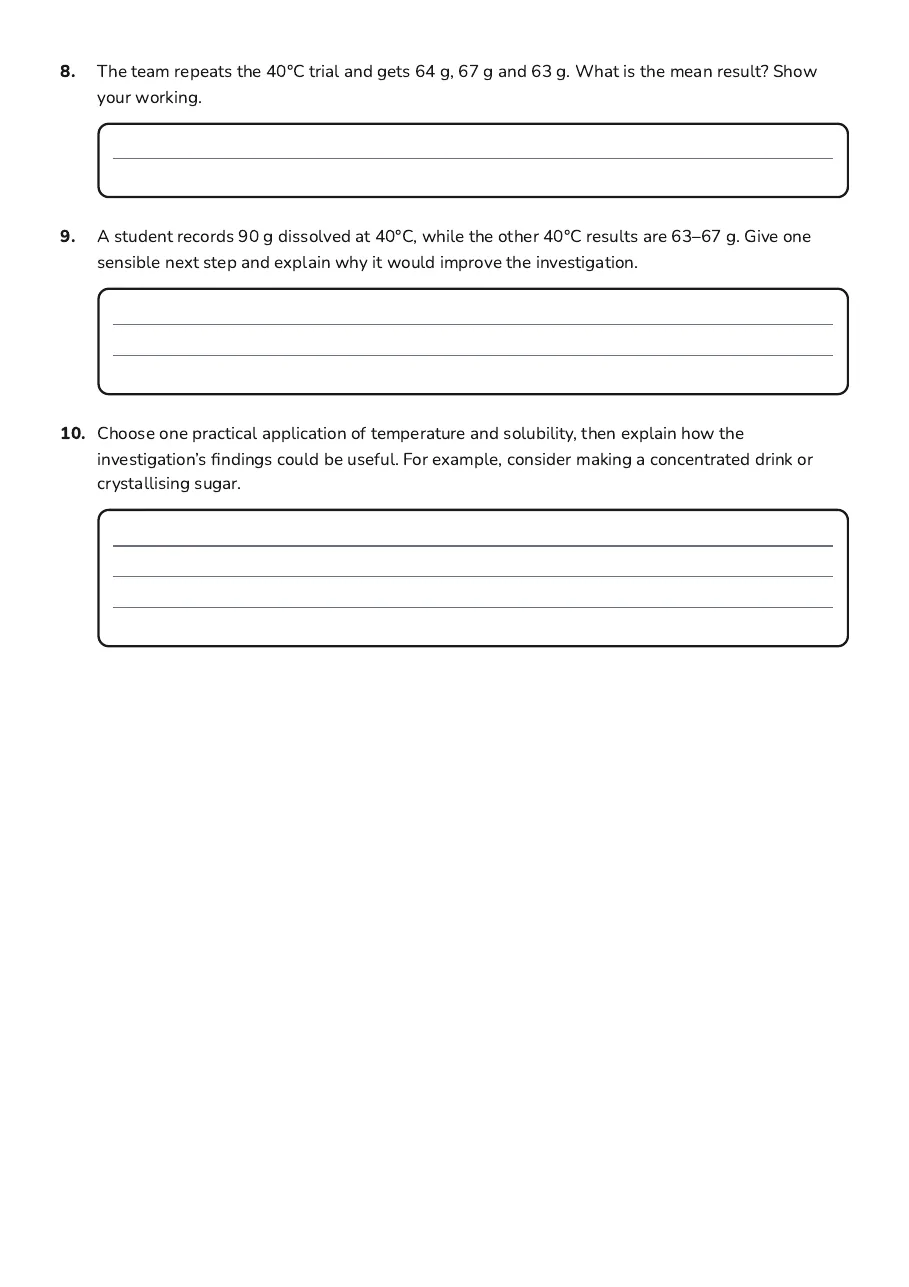
8.The team repeats the 40°C trial and gets 64 g, 67 g and 63 g. What is the mean result? Show your working.
9.A student records 90 g dissolved at 40°C, while the other 40°C results are 63–67 g. Give one sensible next step and explain why it would improve the investigation.
10.Choose one practical application of temperature and solubility, then explain how the investigation’s findings could be useful. For example, consider making a concentrated drink or crystallising sugar.

3 printable pages

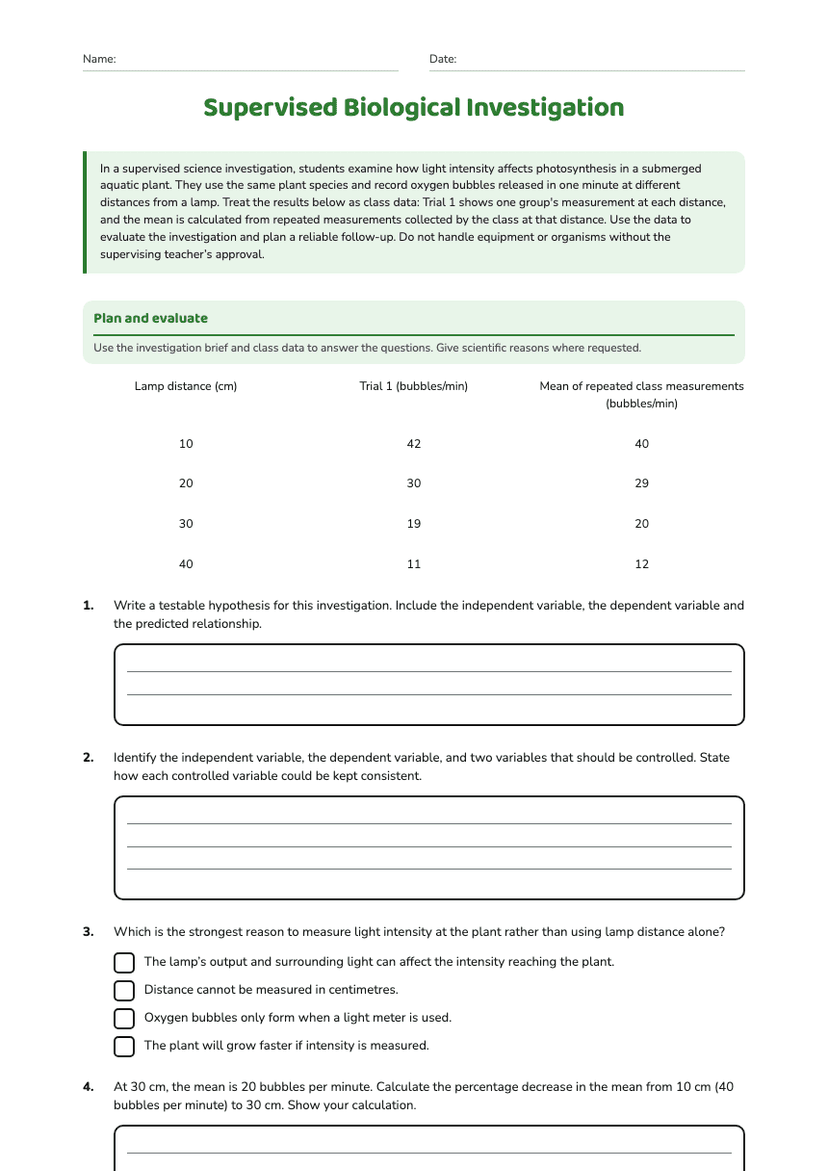
  • Temperature and Solubility Investigation, page 1 of 3: Plan a fair test

    Page 1

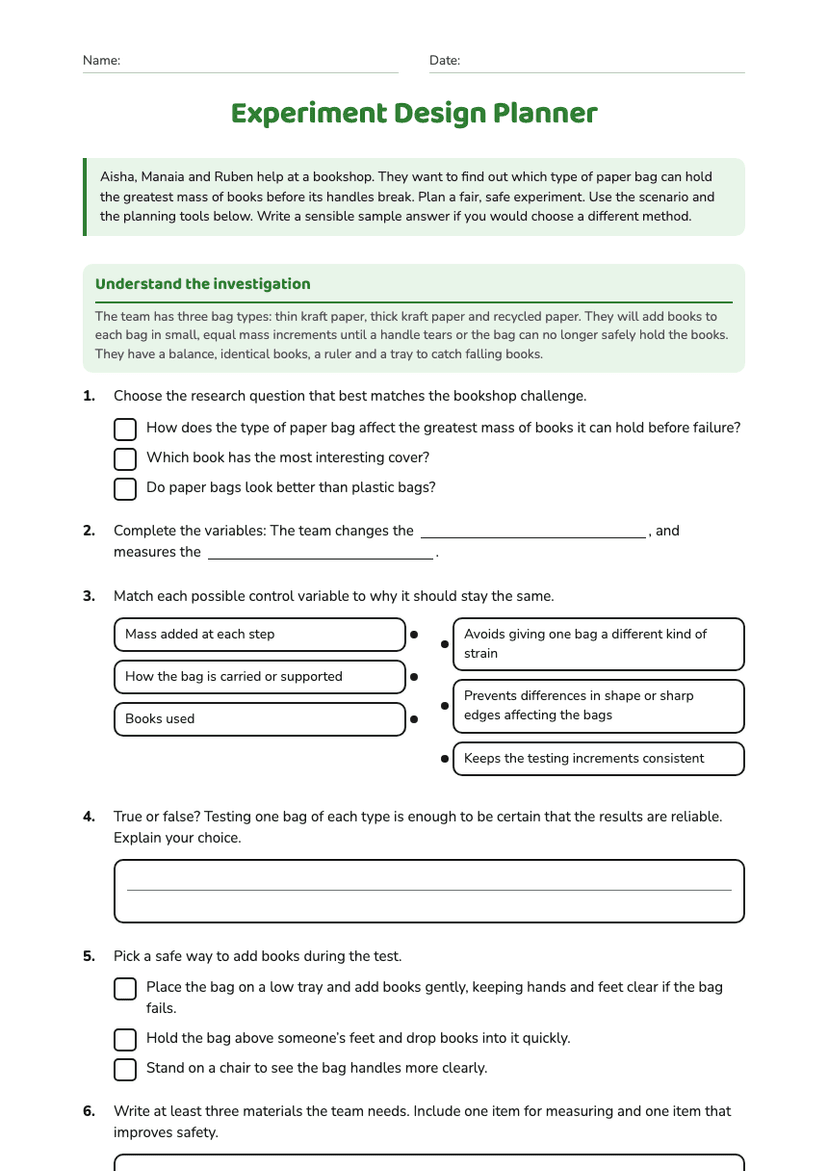
  • Temperature and Solubility Investigation, page 2 of 3: 3. State a testable hypothesis predicting how the mass of sugar dissolved will change as…

    Page 2

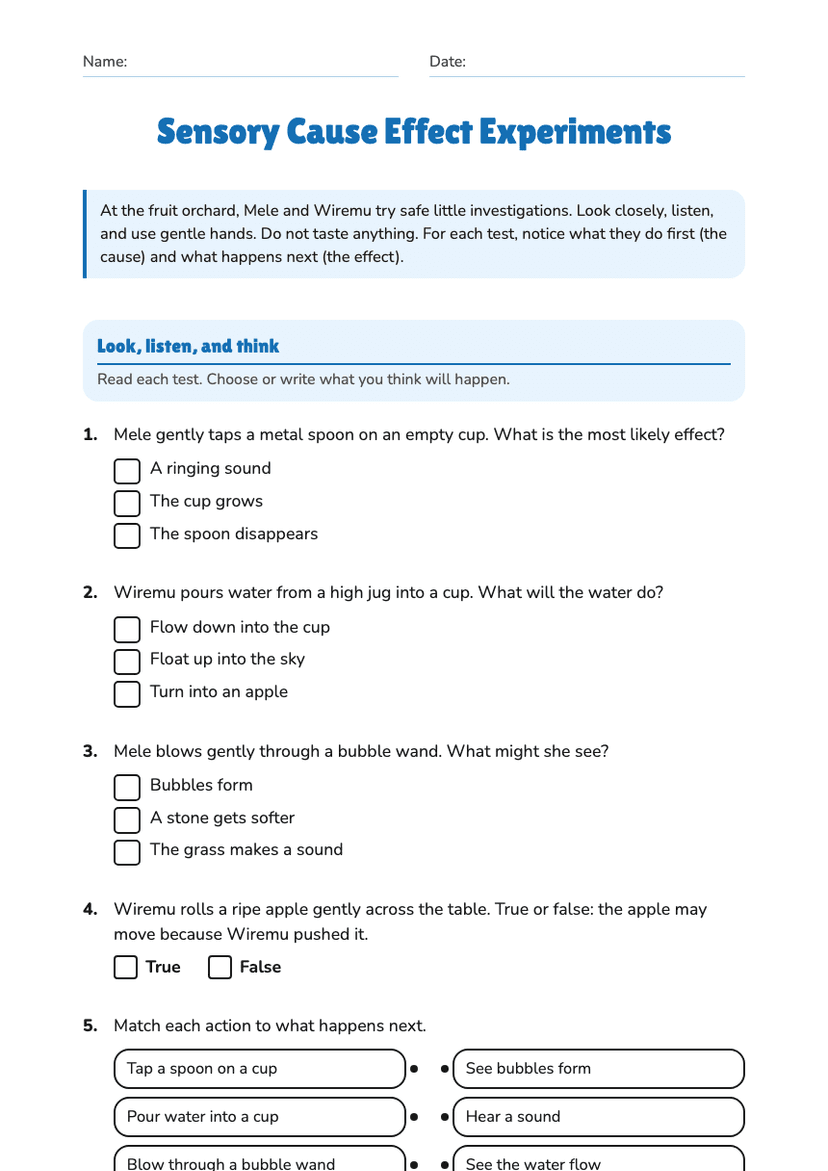
  • Temperature and Solubility Investigation, page 3 of 3: 8. The team repeats the 40°C trial and gets 64 g, 67 g and 63 g. What is the mean result?…

    Page 3

About This Worksheet

Free in Kuraplan

Sign up free, grab the PDF, and customize it for your class.

Print-Ready

Formatted for standard paper. Clean layout, easy to read.

AI-Generated

Created with Kuraplan's AI, designed for real classroom use.

For Teachers & Parents

Use in classrooms, for homework, tutoring, or homeschool.

Need a custom version of this worksheet?

Kuraplan's AI generates custom worksheets in seconds — differentiated for every learner, aligned to your curriculum.

Generate Custom Worksheets — Free
No credit card Curriculum-aligned Under 60 seconds