MathsFreePrintable
Variables and Graphs
A free maths worksheet ready for your classroom. Open in Kuraplan to grab the print-ready PDF, customize it for your students, or generate a fresh version in seconds.
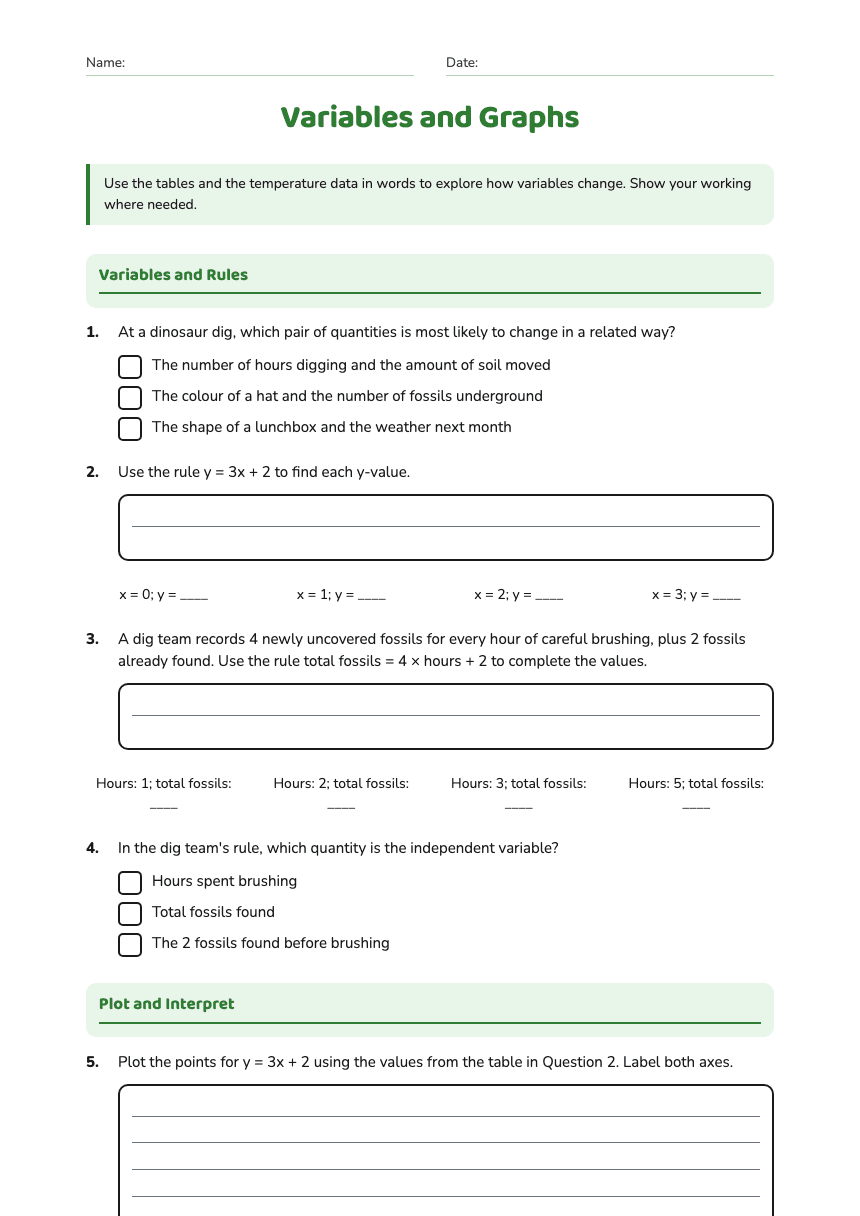
Name:Date:
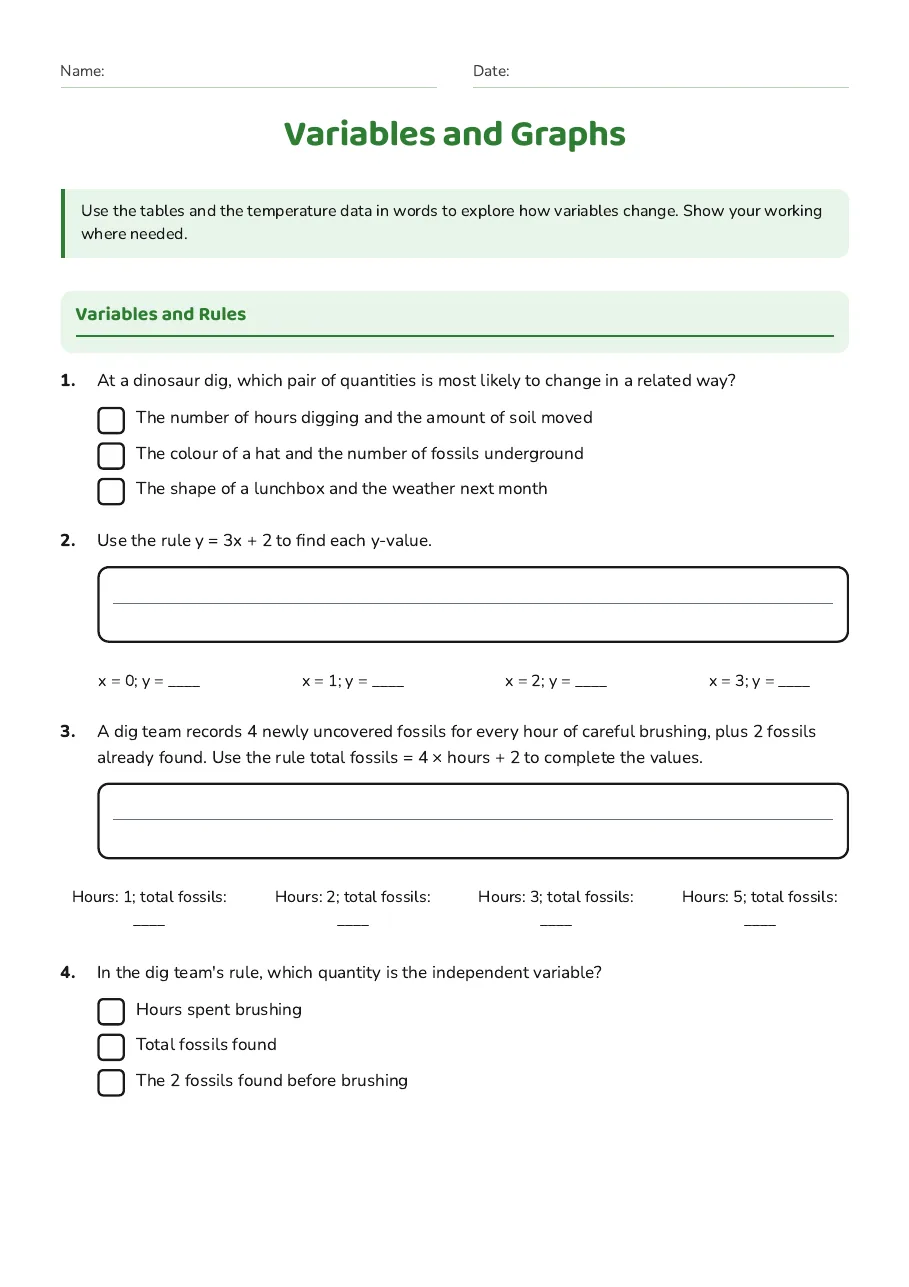
Variables and Graphs
Use the tables and the temperature data in words to explore how variables change. Show your working where needed.
Variables and Rules
1.At a dinosaur dig, which pair of quantities is most likely to change in a related way?
- The number of hours digging and the amount of soil moved
- The colour of a hat and the number of fossils underground
- The shape of a lunchbox and the weather next month
2.Use the rule y = 3x + 2 to find each y-value.
x = 0; y = ____
x = 1; y = ____
x = 2; y = ____
x = 3; y = ____
3.A dig team records 4 newly uncovered fossils for every hour of careful brushing, plus 2 fossils already found. Use the rule total fossils = 4 × hours + 2 to complete the values.
Hours: 1; total fossils: ____
Hours: 2; total fossils: ____
Hours: 3; total fossils: ____
Hours: 5; total fossils: ____
4.In the dig team's rule, which quantity is the independent variable?
- Hours spent brushing
- Total fossils found
- The 2 fossils found before brushing
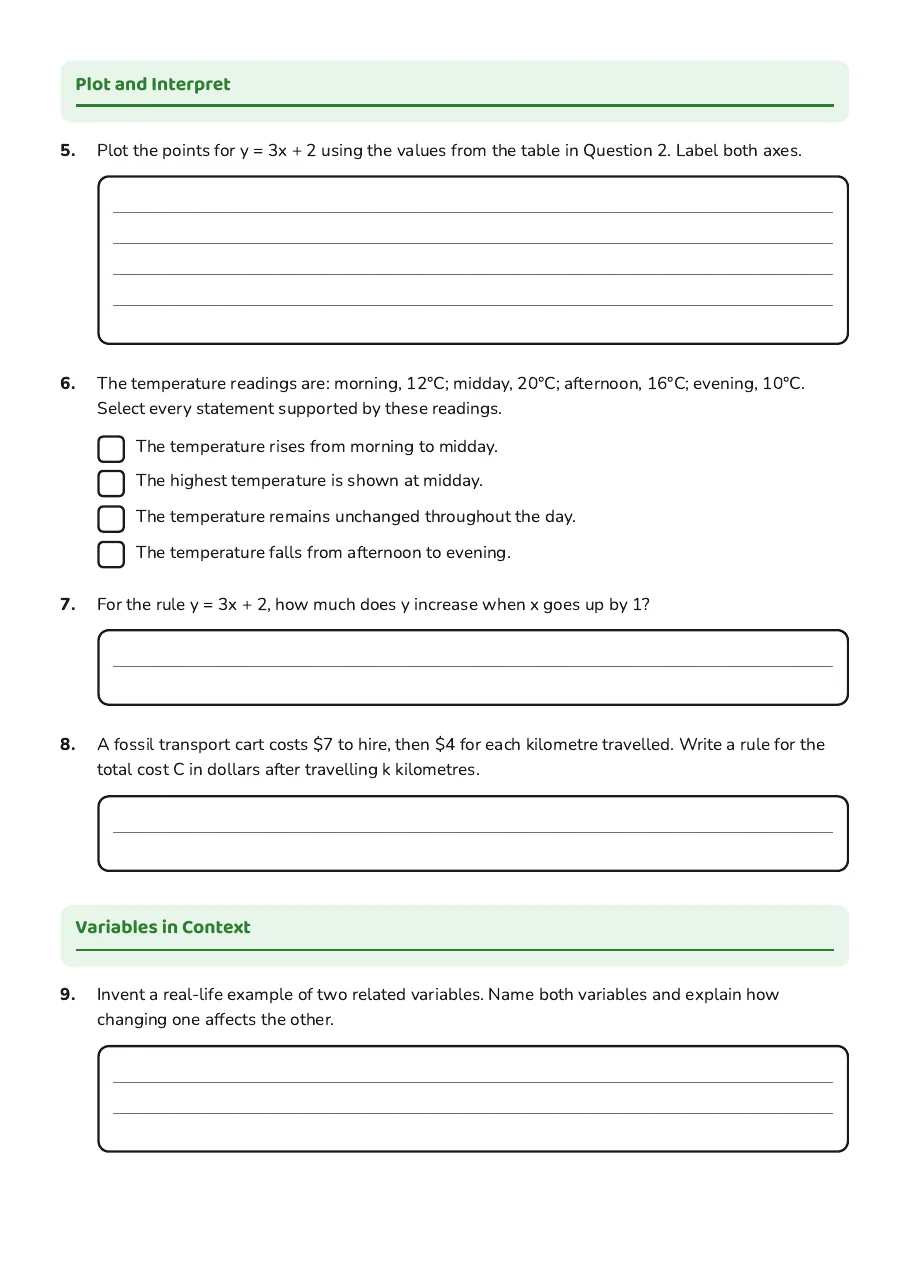
Plot and Interpret
5.Plot the points for y = 3x + 2 using the values from the table in Question 2. Label both axes.
6.The temperature readings are: morning, 12°C; midday, 20°C; afternoon, 16°C; evening, 10°C. Select every statement supported by these readings.
- The temperature rises from morning to midday.
- The highest temperature is shown at midday.
- The temperature remains unchanged throughout the day.
- The temperature falls from afternoon to evening.
7.For the rule y = 3x + 2, how much does y increase when x goes up by 1?
8.A fossil transport cart costs $7 to hire, then $4 for each kilometre travelled. Write a rule for the total cost C in dollars after travelling k kilometres.
Variables in Context
9.Invent a real-life example of two related variables. Name both variables and explain how changing one affects the other.
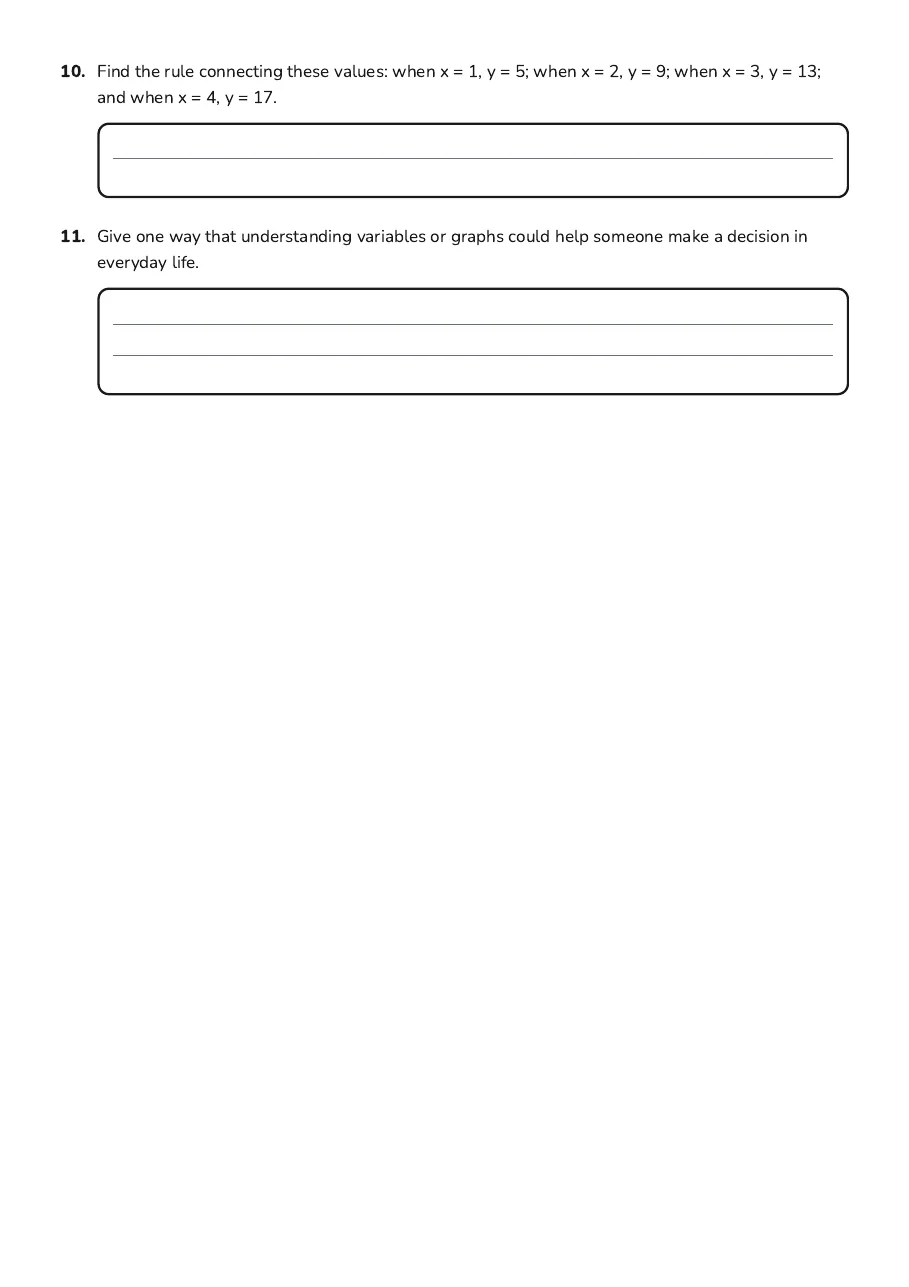
10.Find the rule connecting these values: when x = 1, y = 5; when x = 2, y = 9; when x = 3, y = 13; and when x = 4, y = 17.
11.Give one way that understanding variables or graphs could help someone make a decision in everyday life.
3 printable pages
Page 1
Page 2
Page 3
About This Worksheet
Free in Kuraplan
Sign up free, grab the PDF, and customize it for your class.
Print-Ready
Formatted for standard paper. Clean layout, easy to read.
AI-Generated
Created with Kuraplan's AI, designed for real classroom use.
For Teachers & Parents
Use in classrooms, for homework, tutoring, or homeschool.
Need a custom version of this worksheet?
Kuraplan's AI generates custom worksheets in seconds — differentiated for every learner, aligned to your curriculum.
Generate Custom Worksheets — Free No credit card Curriculum-aligned Under 60 seconds