MathsFreePrintable
Venn Diagrams & Tables
A free maths worksheet ready for your classroom. Open in Kuraplan to grab the print-ready PDF, customize it for your students, or generate a fresh version in seconds.
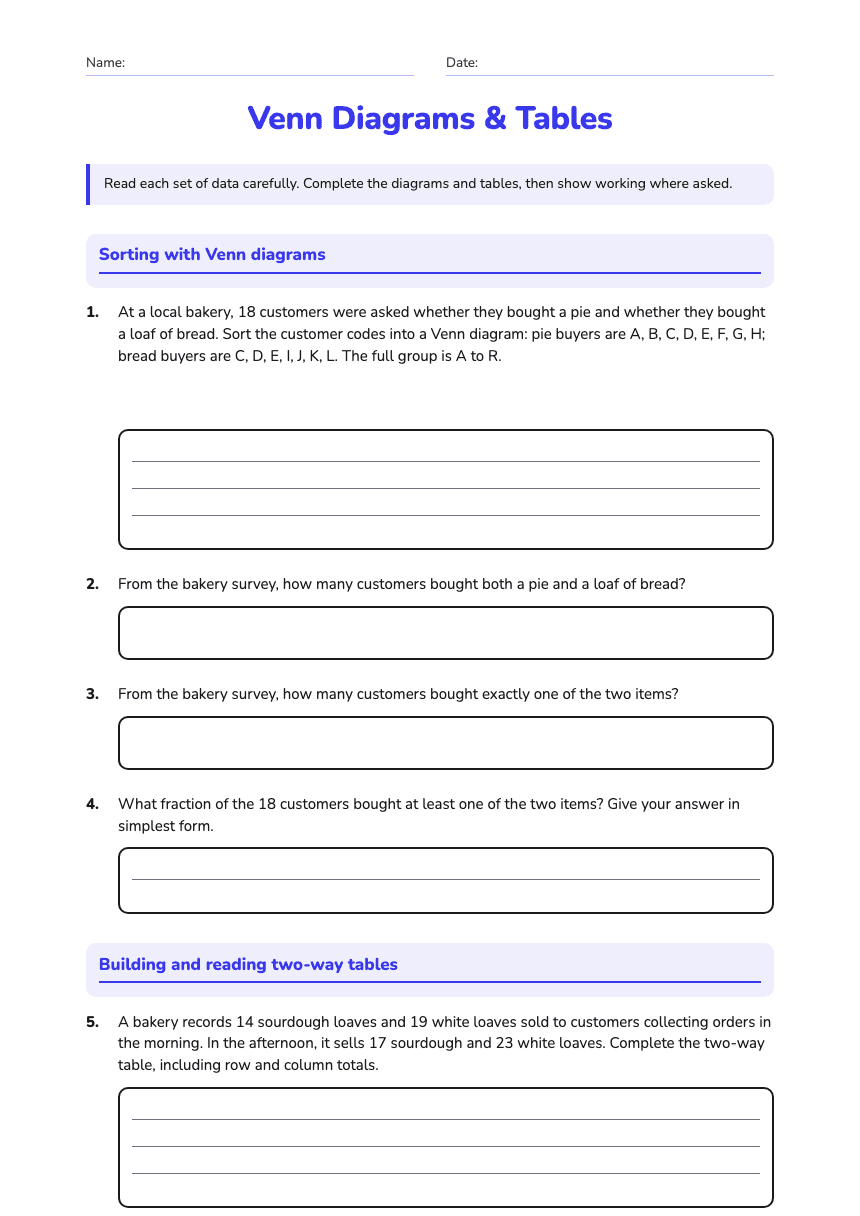
Name:Date:
Venn Diagrams & Tables
Read each set of data carefully. Complete the diagrams and tables, then show working where asked.
Sorting with Venn diagrams
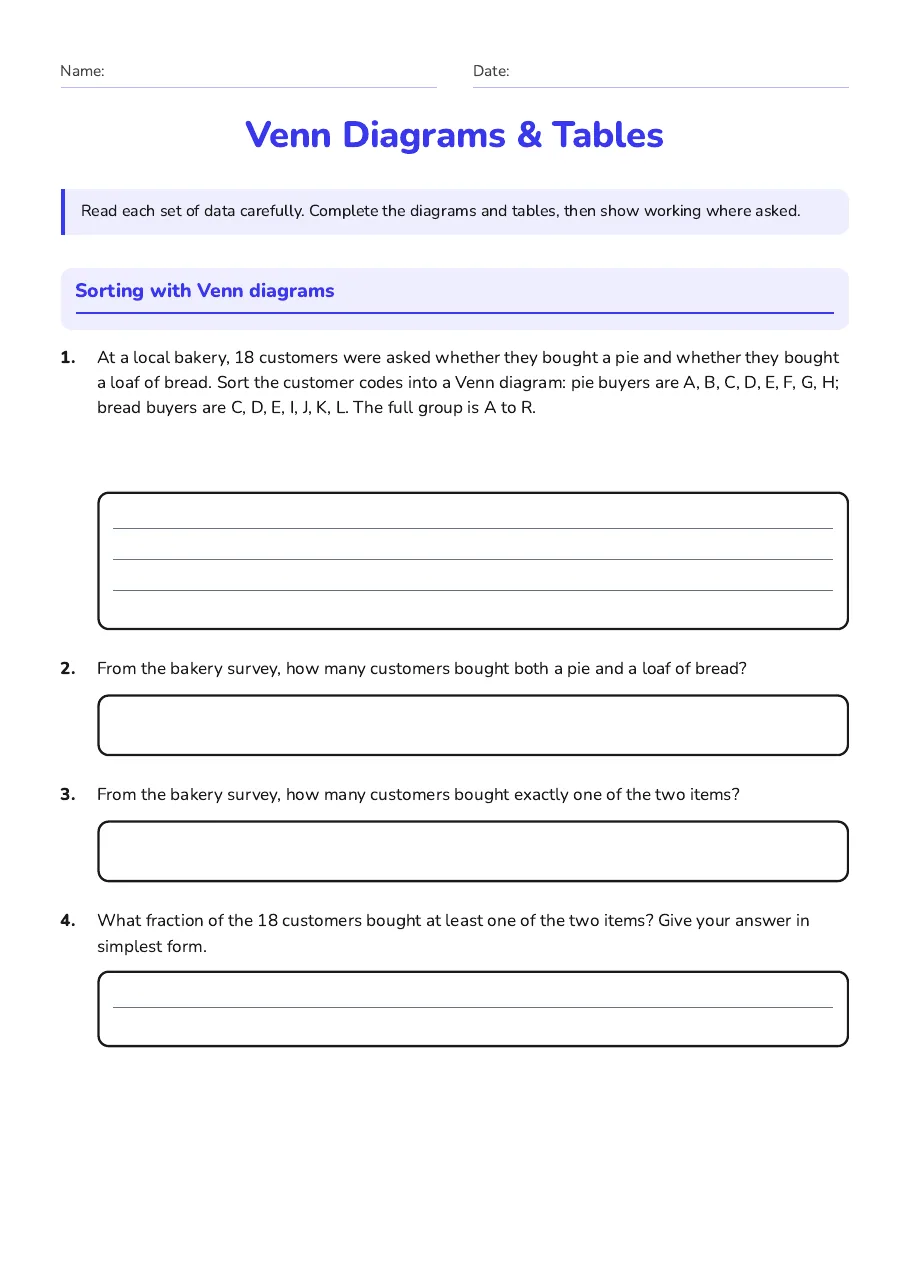
1.At a local bakery, 18 customers were asked whether they bought a pie and whether they bought a loaf of bread. Sort the customer codes into a Venn diagram: pie buyers are A, B, C, D, E, F, G, H; bread buyers are C, D, E, I, J, K, L. The full group is A to R.
2.From the bakery survey, how many customers bought both a pie and a loaf of bread?
3.From the bakery survey, how many customers bought exactly one of the two items?
4.What fraction of the 18 customers bought at least one of the two items? Give your answer in simplest form.
Building and reading two-way tables
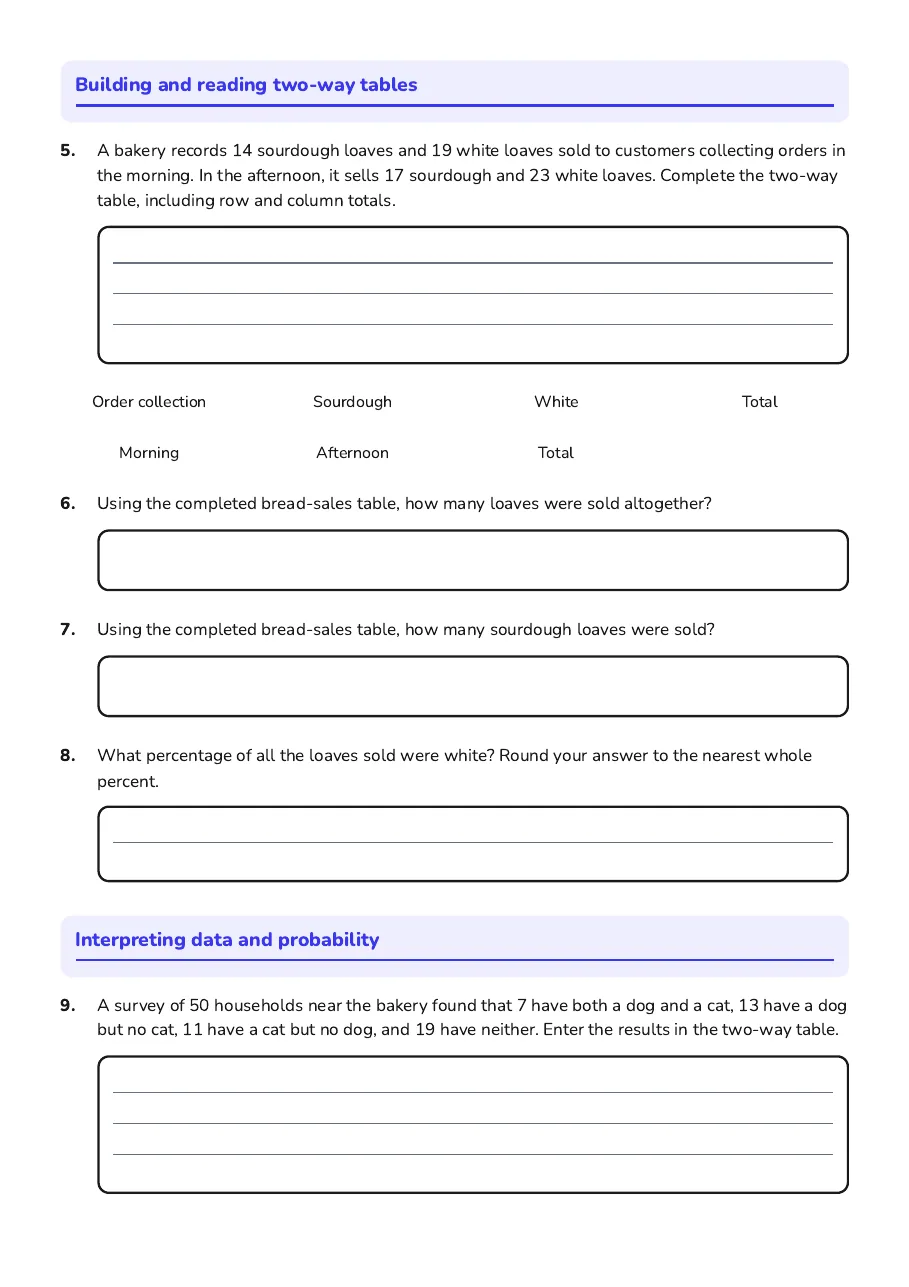
5.A bakery records 14 sourdough loaves and 19 white loaves sold to customers collecting orders in the morning. In the afternoon, it sells 17 sourdough and 23 white loaves. Complete the two-way table, including row and column totals.
Order collection
Sourdough
White
Total
Morning
Afternoon
Total
6.Using the completed bread-sales table, how many loaves were sold altogether?
7.Using the completed bread-sales table, how many sourdough loaves were sold?
8.What percentage of all the loaves sold were white? Round your answer to the nearest whole percent.
Interpreting data and probability
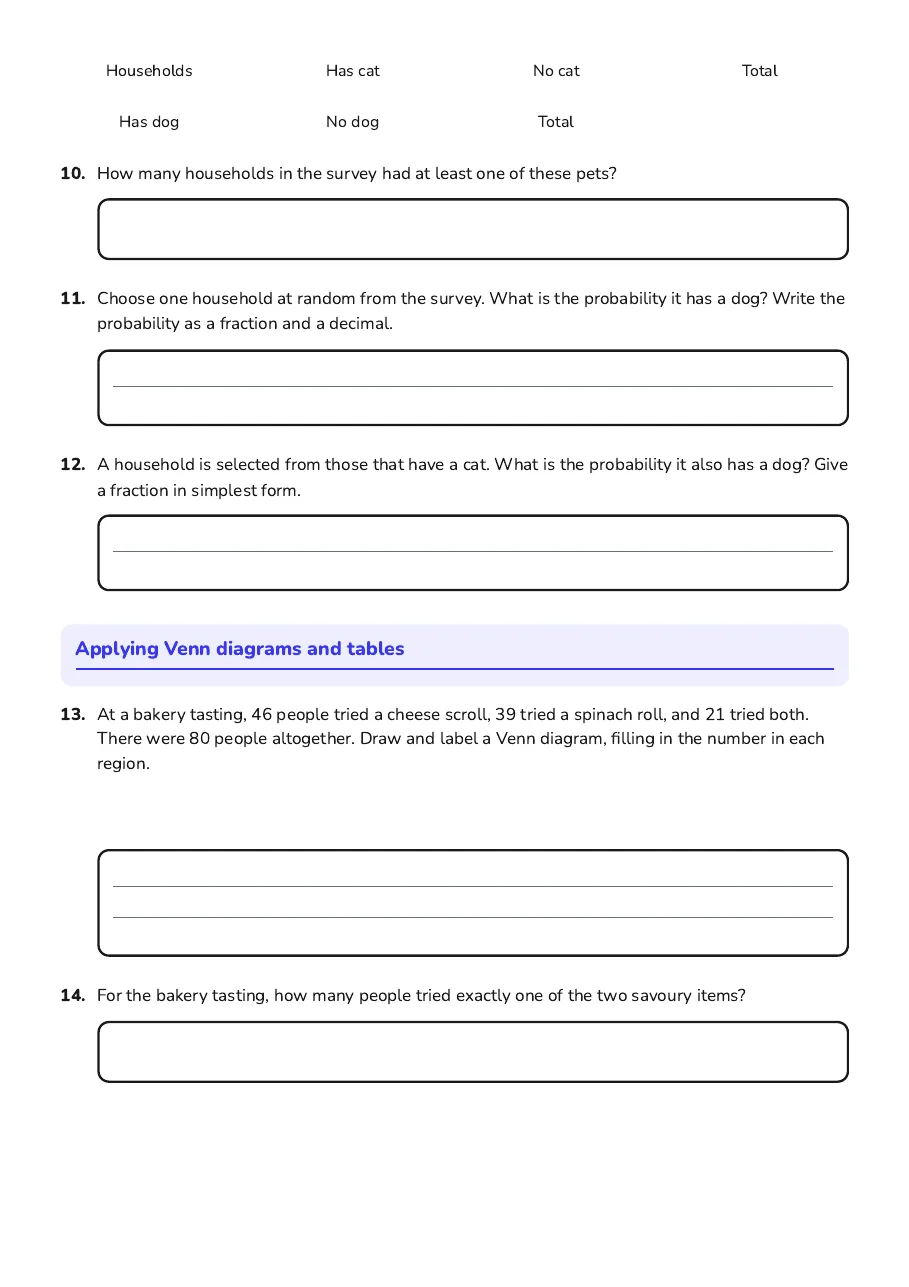
9.A survey of 50 households near the bakery found that 7 have both a dog and a cat, 13 have a dog but no cat, 11 have a cat but no dog, and 19 have neither. Enter the results in the two-way table.
Households
Has cat
No cat
Total
Has dog
No dog
Total
10.How many households in the survey had at least one of these pets?
11.Choose one household at random from the survey. What is the probability it has a dog? Write the probability as a fraction and a decimal.
12.A household is selected from those that have a cat. What is the probability it also has a dog? Give a fraction in simplest form.
Applying Venn diagrams and tables
13.At a bakery tasting, 46 people tried a cheese scroll, 39 tried a spinach roll, and 21 tried both. There were 80 people altogether. Draw and label a Venn diagram, filling in the number in each region.
14.For the bakery tasting, how many people tried exactly one of the two savoury items?
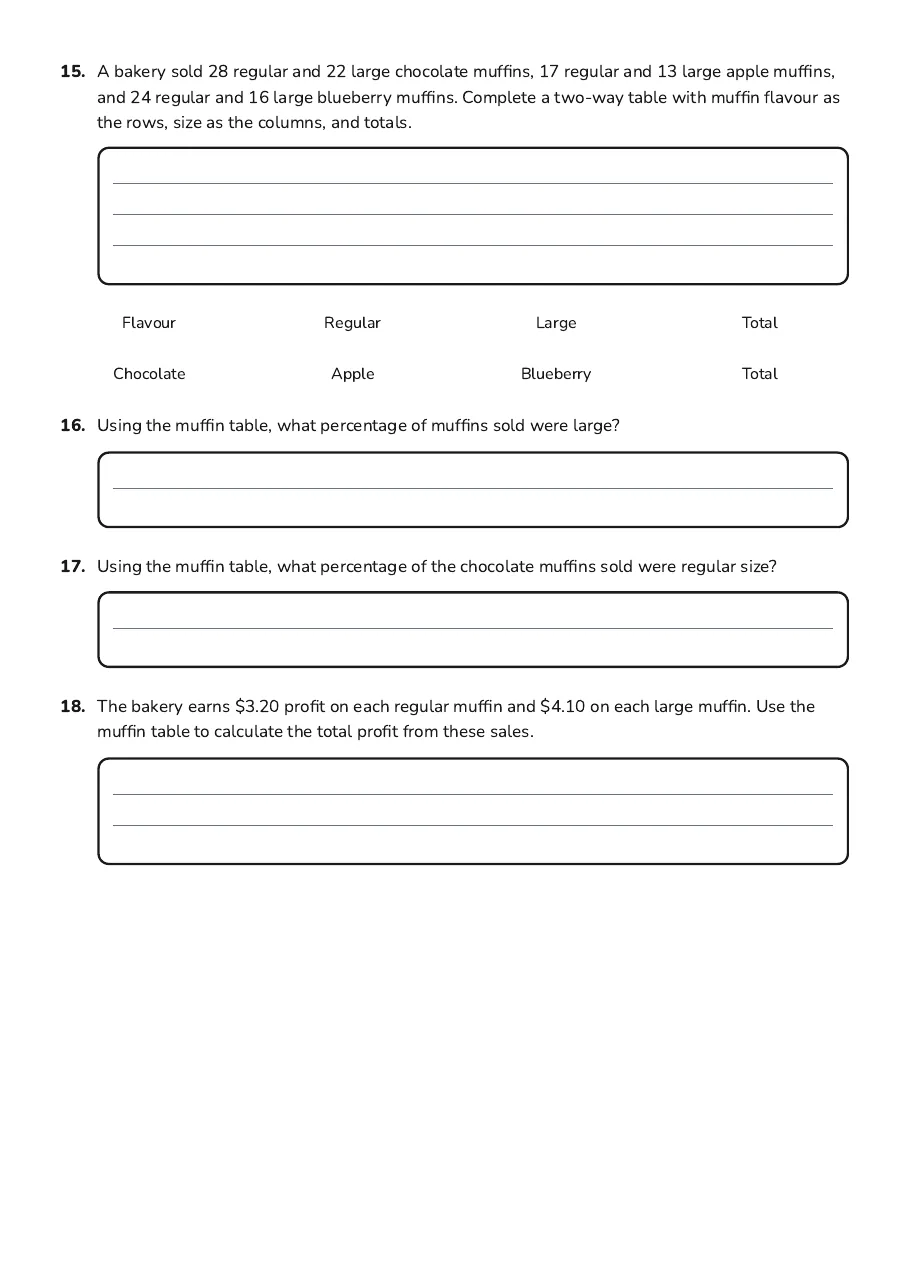
15.A bakery sold 28 regular and 22 large chocolate muffins, 17 regular and 13 large apple muffins, and 24 regular and 16 large blueberry muffins. Complete a two-way table with muffin flavour as the rows, size as the columns, and totals.
Flavour
Regular
Large
Total
Chocolate
Apple
Blueberry
Total
16.Using the muffin table, what percentage of muffins sold were large?
17.Using the muffin table, what percentage of the chocolate muffins sold were regular size?
18.The bakery earns $3.20 profit on each regular muffin and $4.10 on each large muffin. Use the muffin table to calculate the total profit from these sales.
4 printable pages
Page 1
Page 2
Page 3
Page 4
About This Worksheet
Free in Kuraplan
Sign up free, grab the PDF, and customize it for your class.
Print-Ready
Formatted for standard paper. Clean layout, easy to read.
AI-Generated
Created with Kuraplan's AI, designed for real classroom use.
For Teachers & Parents
Use in classrooms, for homework, tutoring, or homeschool.
Need a custom version of this worksheet?
Kuraplan's AI generates custom worksheets in seconds — differentiated for every learner, aligned to your curriculum.
Generate Custom Worksheets — Free No credit card Curriculum-aligned Under 60 seconds